Tuesday, January 22, 2013
TRADING RULES

There are not to many other businesses that allow for that much freedom. Because there really aren’t any set rules, you’ll need to make your own. Otherwise, you’ll most likely be overwhelmed with all the different possibilities in the market.
If you decide to trade without any rules, I promise you will not be successful. Freedom is good, but you need to have what I call a “structured freedom.” Basically, that means you should be able to trade when you want to, but the trades you do need to fall under your set rules. Rules will help you be more consistent with your trading. They’ll help you avoid mental mistakes that can drain your account.
About once every six months I write a new set of trading rules for myself. These rules help me to be structured with my trading. And you know, it’s the strangest thing, when I have a bad day, it’s because I didn’t follow one or more of my rules. And, of course, the opposite is usually true. If I’ve had a good day trading, it’s because I did follow my rules.
No matter what type of trading you’re doing (swing trading, day trading, long-term trading), you’ll need to come up with your own set of rules to keep your trading structured. The problem is most people don’t want to make up their own rules, because if they did they would have to take responsibility for their results. And, as we all know, most people don’t want to take responsibility for their action. But, as we all know, the only way to be successful in trading is to take 100% responsibility and act in our own best interest.
For those that don’t know, I day trade the S&P 500 Futures almost exclusively. I updated my rules in July of 1998. I thought it might help you to see what my rules look like, and I’ll try to give an ex planation of each rule as it applies to my trading. These are exactly how my rules look taped up to the side of my computer in my office:
1) Always use a stop order. (I never put on a trade without a stop order.)
2) After 3 losing trades in one day, Stop Trading! (I want to avoid digging myself in a huge hole.)
3) If I get 100 points + profit in a trade, I will move my stop to break-even. (If I get decent money in a trade, I will not allow myself to lose money on that trade.)
4) Only use a signal to get into the market. Don’t just take a shot. (I usually get myself in trouble if I have a feeling about the market and act on it. I’m much more successful when I use a chart formation or a technical reason to get into the market.)
5) Use The Secrets of Floor Traders Rules. They work!!! (This is the course I’ve putt together for day trading the S&P’s. It includes all the techniques that I use to trade.)
6) Do not trade on holiday type volume. Too slow bad opportunities. Go outside, watch a movie, whatever! (In almost every case, when I trade in these types of markets, my winning trades are much smaller, and my losers are much bigger. It’s not worth it.)
7) Always act with your best interest in mind. (This is something I try and do with each and every trade I put on. I realize that only I’m responsible for my results.)
8) Consistently trade on long side above value and the short side below value. (I use the Value Area to help stay on the right side of the market.)
9) Always look for single ticks to help you execute your trades. (This is a Market Profile technique that I use to help me find support and resistance areas.)
10) Relax with your trades. If it’s not fun and enjoyable, it’s not worth doing. (This is self-explanatory. If you don’t enjoy it, you won’t be successful.)
11) You don’t have to trade everyday. (Sometimes I’ll just leave the market alone and forget about it for a day. It usually refreshes me.)
12) Waiting till the market shows you whether it is one-time framing or not is an excellent way to be patient waiting to f ind an opportunity to trade. (One-Time Framing is a trend following technique that I watch for constantly.)
Those are the exact rules that I use each and everyday, and it’s almost automatic. After a bad day trading, I will look at my rules and see that I did not follow them like I should have. And again, the opposite is true. After a good day, I’ll look at them and see that I followed them very well.
I really believe my ability to follow those exact rules is a direct reflection of how much money I will make with my trading. The more I follow them, the better I trade.
I’m quite sure the same thing will happen for you. Although I would say you’ll want to come up with your own set of rules. You can certainly use mine as a guide, but the important thing is you must be comfortable with the rules you come up with. I know that I’m very comfortable with my rules. You’ll need to do that with your rules. If you’re not comfortable, they will be very difficult for you to follow and the odds of you being profitable will be very low.
One thing that is common in trading is the temptation to not follow your rules just this one time. This comes from the very real possibility of the exciting results that are possible. This is the trap that many new traders (and some experienced ones too) fall into. This trap is easy to fall into because many people have a terrible fear of missing out on a big move. A good example would be when you see the Dow Jones up 250 points and you feel as though you must find a way to get long the S&P market even if it breaks many of your rules to do so.
Avoid at all costs getting caught in that trap. Doing a trade because you’re afraid of missing out on a big move is not acting in your best interest. I’ve got news for you, there are big moves almost everyday.
Besides, most people do not think about missing those big moves in a realistic way. When you’ve missed an opportunity, you have a tendency to think about it unrealistically. You see the bottom and the top of the big move and think to yourself that you would have been able to capture the entire move. I think we all know that isn’t likely to happen. But our mind plays tricks on us and says we shouldn’t have missed out.
Again, the market doesn’t stop moving. If you weren’t able to get into the previous opportunity, look for the next one. Don’t let your mind play tricks on you.
The more you follow your rules, the more you’ll trust yourself and the better your results will be. Remember, only you are responsible for your trading results, good or bad. Having a set of rules will help you get more good than bad.
Saturday, January 19, 2013
DO YOU DESERVE TO MAKE MONEY?
Many people have a certain idea of how long and how much effort it takes to make a certain amount of money. Most job situations offer an unchanging reward regardless of effort. This is very different than trading the markets. Most of us are brought up with ideas like working a hard day’s work is what it takes to make money.
Very few of us are brought up with the idea that you can make literally thousands of dollars in a matter of minutes with very little expended effort other than picking up the phone and placing a timely trade. This is foreign to most people. And, more importantly, it doesn’t fit the picture most people have of themselves. For instance, if your father worked 11 hours a day, 6 days a week to put food on your family’s table, then it’s only natural that your idea of making money would include hard work and long hours. You spent much of your childhood seeing it done that way.
Because of that, the picture of yourself could most likely be one that is undeserving of money if you don’t put in long, hard hours to make that money. If that is the case, then this picture of yourself is very, very important. The picture you have of yourself is the basis of the psycho-cybernetics techniques, which we’ll talk a lot about in Section 3 of this book. But let me just to give you some background of how it works.
We all have a picture of ourselves in our subconscious. This picture is called the self-image. The self-image controls everything we do in life. It is what we believe to be true about ourselves. It may not necessarily be true, but it is what we believe to be true. Our self-image has a stronger hold on us than you could ever imagine. For instance, if we believe that people don’t deserve to make money as fast as is possible trading the markets, then undoubtedly what will happen if we make money very quickly in the market is our self-image will say, “This is not right, people shouldn’t make money this fast.” And our powerful subconscious will find a way to give that money right back. It is inevitable that it will happen this way. It is very difficult to do something consistently that does not agree with your self-image. It’s proven in hundreds of thousands of scientific cases.
A good example is someone trying to lose weight. Many times people have the picture of themselves as an overweight person. They attempt to try and lose weight using willpower. They go to the gym, try and eat healthier foods and avoid fatty foods. All that is great. But the reason most people can’t lose weight (or they gain it right back) is because they have that powerful picture of themselves as an overweight person fighting against them.
The self-image is much stronger than any willpower you can come up with. So, until they change the picture they see of themselves, it will be next to impossible to lose weight and keep it off. But when they do change the picture of themselves, it won’t be very difficult at all to lose weight and keep it off. In other words, when they can see themselves as a thin person, it’s not very difficult to become a thin person.
The same is true about whether you deserve to make money as a trader. If you have a self-image that states it isn’t right to be able to make money so quickly, then you will be fighting a losing battle against your powerful self-image. The self-image will always win.
Just like the person trying to lose weight, you will only become successful when you have the correct picture of yourself. The picture must be of a person who is deserving of making money in the trading environment. If that is not the picture you currently have of yourself, you’ll need to change that picture. The Psycho-Cybernetics techniques in Section 3 will teach you how to change the picture you have of yourself so you will be deserving of making money with your trading.
 |
| DO YOU DESERVE TO MAKE MONEY? |
Very few of us are brought up with the idea that you can make literally thousands of dollars in a matter of minutes with very little expended effort other than picking up the phone and placing a timely trade. This is foreign to most people. And, more importantly, it doesn’t fit the picture most people have of themselves. For instance, if your father worked 11 hours a day, 6 days a week to put food on your family’s table, then it’s only natural that your idea of making money would include hard work and long hours. You spent much of your childhood seeing it done that way.
Because of that, the picture of yourself could most likely be one that is undeserving of money if you don’t put in long, hard hours to make that money. If that is the case, then this picture of yourself is very, very important. The picture you have of yourself is the basis of the psycho-cybernetics techniques, which we’ll talk a lot about in Section 3 of this book. But let me just to give you some background of how it works.
We all have a picture of ourselves in our subconscious. This picture is called the self-image. The self-image controls everything we do in life. It is what we believe to be true about ourselves. It may not necessarily be true, but it is what we believe to be true. Our self-image has a stronger hold on us than you could ever imagine. For instance, if we believe that people don’t deserve to make money as fast as is possible trading the markets, then undoubtedly what will happen if we make money very quickly in the market is our self-image will say, “This is not right, people shouldn’t make money this fast.” And our powerful subconscious will find a way to give that money right back. It is inevitable that it will happen this way. It is very difficult to do something consistently that does not agree with your self-image. It’s proven in hundreds of thousands of scientific cases.
A good example is someone trying to lose weight. Many times people have the picture of themselves as an overweight person. They attempt to try and lose weight using willpower. They go to the gym, try and eat healthier foods and avoid fatty foods. All that is great. But the reason most people can’t lose weight (or they gain it right back) is because they have that powerful picture of themselves as an overweight person fighting against them.
The self-image is much stronger than any willpower you can come up with. So, until they change the picture they see of themselves, it will be next to impossible to lose weight and keep it off. But when they do change the picture of themselves, it won’t be very difficult at all to lose weight and keep it off. In other words, when they can see themselves as a thin person, it’s not very difficult to become a thin person.
The same is true about whether you deserve to make money as a trader. If you have a self-image that states it isn’t right to be able to make money so quickly, then you will be fighting a losing battle against your powerful self-image. The self-image will always win.
Just like the person trying to lose weight, you will only become successful when you have the correct picture of yourself. The picture must be of a person who is deserving of making money in the trading environment. If that is not the picture you currently have of yourself, you’ll need to change that picture. The Psycho-Cybernetics techniques in Section 3 will teach you how to change the picture you have of yourself so you will be deserving of making money with your trading.
Tuesday, January 15, 2013
TIME HAS NO BEARING ON MONEY
 Most of us have ideas about the amount of time it takes to make a certain amount of money. These ideas do not apply to trading the markets. A trader can literally make thousands of dollars in a matter of minutes or even seconds with very little effort expended at all. This is very different than what most people are brought up to believe is possible about making money.
Most people are raised to believe that to make money (especially large sums of money), it takes much time and effort. When I first started trading, my family and friends couldn’t understand how, in just a matter of minutes, I could have the possibility of being up or down many thousands of dollars. People don’t make thousands of dollars in minutes. It takes weeks. At least it does in most businesses.
To many people, the possibility to make or lose money that quickly is something they’ll never experience. But to a trader, this is something we experience on a daily basis. To be a successful trader, you’ll definitely need to get used to it.
The problem is many people have a mental conflict with that kind of situation. Because of our upbringing, we have certain beliefs about whether we deserve to make money that quickly. In many cases, we are so taken back that we made that much money so fast, that it doesn’t seem to be right that we could have that much that quickly. This leads to two serious problems.
The first problem is the big one. If you subconsciously don’t feel you deserve to make money so quickly, then when we do get that quick windfall, our subconscious will say, “Hey you can’t make money that fast! We’d better find a way to give that money back!”
And believe it or not, you will most likely end up doing just that. That is how powerful your subconscious is. If you have a certain belief about yourself, your subconscious will strive to make that belief true. For instance, if you do make a large profit very quickly, you will find a way to give that money back because inside you it doesn’t feel right. It might feel great and exciting to have made so much so quickly, but deep inside, in your subconscious, it is not right at all. And your super-powerful subconscious will override your conscious thoughts and find a way to give back that money you didn’t feel you deserved in the first place.
In Section 3, we will talk about an ex ercise to become comfortable with large windfalls. You’ll learn how to be deserving of those windfalls so your subconscious does not try and force you to give the money back. The second problem with this mental conflict is it causes people to stay in trades way too
long. Here’s what happens:
A person gets into a trade and for whatever reason it goes their way right away. They make those thousands of dollars we just talked about in only a few minutes. This is great, but the problem comes up when they feel the trade must be worth much, much more. They feel this way because it moved their way so quickly that the market just has to keep moving in this direction.
Well, we all know the market doesn’t have to do anything. It only does what the buy and sell orders cause it to do. I see this situation all the time. One of the most important things you must realize about trading is that the market can take away profits just as easily as it can give them and just as quickly. Because of this fact, you must protect your trading. Of course, that means you should be trailing your stop orders to lock in profits. But it also means you need to protect yourself mentally.
But a lot of people get caught up in thinking that it does. That is a big mistake. For instance, let’s say you get short the S&P 500 Futures. Right after you get short, a huge sell order comes in to sell 2000 contracts at the market. This particular order drops the market like a rock. After that order is filled, you are sitting on a $2,500 profit in a matter of less than a minute. You are sure that after falling that much that quickly the market must be completely ready to fall apart. But this is not necessarily true. In fact, just the opposite happens, without more selling, the market starts to rally back up taking much of your profits with it.
The only way to deal with these situations is to be mentally prepared for them to happen, because they will happen. Instead of being so sure that the market must do what you think it should do (continuing in your direction), you must be prepared that it can do anything (like taking away your quick windfall just as fast you got it in the first place). By being mentally prepared for this type of situation, you act in your own best interest by not letting the lion’s share of your profits get away from you. Sure, in the above situation, the market hopefully will keep going in your direction, but the most important thing you need to be concerned with is what to do if the market doesn’t keep moving in your direction (e.g. trailing your stop order, covering half your position if you’re trading multiple contracts, etc.).
Remember, acting in your own best interest to protect yourself is much more important than finding winning trades. Don’t get caught up in thinking the market must keep going if it moved this far, this fast. It doesn’t have to do anything, no matter what it just did. Keep yourself prepared for whatever it does and you’ll have a much better chance of holding onto your profits.
Years ago, I got some advice from a fellow trader in the S&P pit. He told me to never get married to a trade. Michael Douglas told Charlie Sheen to never get emotional about a stock (in the movie Wall Street). Those statements are much more than just pieces of advice picked up along the way. If you don’t remain flexible and stay detached from your trades, you will not become successful in this business.
Basically, what this means is very simple. No matter how strongly you feel about a trade, you need to be willing to give up on it in a moment’s notice. A very common occurrence for a trader is to get caught up in the particular trade they are in and put much more weight in that trade than it deserves.
For instance, I’ve talked to a lot of traders who’ve experienced a common feeling when in a trade. I’ve even experienced it myself, occasionally. You feel as though you have to be right on this particular trade. This causes you to be inflexible about getting out of the trade. Even if the market is showing you signs that it isn’t going to continue in your direction, many traders get so attached to their trades that they cannot be flexible enough to act in their own best interest. (Which is the only way to be successful.)
Many times when this happens, the trader feels as though this is the last trade they’ll ever be in. Inflexibility will kill your trading in a hurry. You see, to be a successful trader you need to be willing to change your mind quickly and easily. You certainly can’t be fighting with yourself back and forth when you’ve got an open position in the market. It will be a disaster. In the real world, having a large ego can sometimes be helpful. Many people who’ve got large egos and think they are usually right also have the ability to also convince others that they are right. This works for many people. Those people with large egos don’t need to be as flexible in the real world. At least they do not have to be flexible to the people they can convince they are right.
But in the trading environment, being inflexible and unwilling to admit you’re wrong will do nothing but drain your trading account dry. Of course, nobody wants to admit that they are wrong. Who wants to be wrong???
I try and think about it a different way. I don’t think about it as being wrong in a losing trade. I decided to shift my thinking and instead of thinking of myself as wrong in a losing trade, I think about it this way: If I don’t get out of this bad trade (that has very little potential), it will eat away at my past and future winning trades. And obviously, I don’t want anything to eat away at my winning trades.
This helps me be more flexible and not afraid to cover my losing trades or trades where the profit is deteriorating. I’ve learned to be flexible in these situations because of how much I want to keep my winning trades intact. The less flexible I am about my bad trades, the more they’ll eat away at my good trades. I’m always trying to protect those winning trades because those trades are the one’s that pay my bills each month.
Always remember the more flexible you can be, the more successful your trading will be. In fact, the amount of money you make trading will be in direct proportion to how flexible you can be. If that is not a reason to learn to be more flexible, I don’t know what one would be.
Wednesday, January 9, 2013
SETTING AND ACCOMPLISHING REALISTIC GOALS
 |
| LEARNING TO LOVE TO TAKE A LOSS |
In fact, I’m not sure if you realize it or not, but that’s when people are at their best. People perform at their best when they have a goal clearly in their mind. That is the way the human mind works. When we have a goal clearly in our minds, our subconscious works very hard at helping us to achieve that goal. It does it quite automatically without having to fight using willpower. (This is something you’ll learn much more about when you start learning more about psycho-cybernetics.)
But there is one big catch. You may have a goal clearly in mind, but it must have three important characteristics:
1) Your goal must be realistic.
2) Your goal must be attainable.
3) Your goal must be measurable.
Your goal must be realistic. This means that your goal has to be something that is within your capabilities. Sure, it may be possible to make a million dollars your first year trading, but it’s probably not very realistic because it isn’t within your capabilities yet. Your goal must be attainable. This is similar to a goal being realistic. Again, your goal must be within your capabilities. So, an example might be if you are trying to average $250-$500 a day with your trading from off-the-floor. You have a much better chance of being able to reach that goal versus the goal to make a million dollars this year. Don’t get me wrong, if you are doing very well with your current goal, there’s no reason you can’t raise it somewhat. But you must start with a goal that is attainable and then you can build on it. I highly suggest starting with a small goal and moving up from there.
Your goal must be measurable. This is one I see people making a mistake about all the time. Everybody wants to get rich or make a fortune in the market. That seems to be everybody’s goal. But you know what, that isn’t really a goal. A goal must be measurable. You must be able to know when you’re far away, close, and when you’ve achieved your particular goal. If it’s not measurable, you won’t know when you’re there, and even worse, you won’t know how close you are to reaching your goal.
When I first started working on the trading floor, I spent lots of time talking to different traders about how they were able to make money in the markets. It seemed liked the more I talked to different traders, the more their answers all sounded the same. Realistic, measurable goal-setting is extremely important to being successful in trading. In fact, just trying to make money each day (without a goal) is a road to failure.
The more successful the trader I talked to, the more they would stress how important setting goals was to their success. But you even need to take it a step further. Not only do you need realistic, measurable goals, but you need to visualize yourself reaching those goals on a daily basis. I remember some advice I’d gotten from a very successful off-the-floor trader who’s since past away, “Just as important as setting specific goals, you must visualize yourself successfully reaching those goals each and everyday. If you can’t see yourself in your mind’s eye as a success, there is no chance you will become successful. It just won’t happen!”
We will talk more about visualization techniques in a little while. But I hope you understand how important it is to have specific goals so you can see how your progress is going and quickly determine if things need to be changed. I will tell you from first hand experience that when I’m trading well and making good money, it’s definitely because I’m totally focused on my specific goals. And, on the other hand, when I’m trading poorly, it’s because I’ve lost sight of my goal and I’m not seeing it clearly like I should be.
And you know what? It definitely shows up in my trading results every time. The more you practice realistic goal-setting, the easier it will get for you to do on a consistent basis. As a side note, I happen to know someone who teaches people to day trade the S&P Futures. One of the lessons he teaches his students is to make $250 a day for 20 straight days in a row. You might say $250 is not a lot of money to make in a single day in the S&P futures, but the whole point is for these students to learn to have realistic, attainable goals that they can reach. Once they reach the attainable goal, they can strive to have a somewhat larger goal. Just like anything, you’ll want to start small and slowly make your goal larger.
By the way, most of his students are successful at getting through the 20 days of making $250 each day. Once they’ve gotten that goal, they are ready to move up to a slightly larger goal, of course, as long as it’s still measurable and realistic. Just like anything, it gets easier with repetition and practice.
This is something you’ll hear successful floor traders say all the time. If you’re going to be a successful trader, either on or off-the-floor, you will have to learn to love taking a loss. Basically, what that means is it does not bother you to have a losing trade. Don’t get me wrong, you’re not going to be happy to have a losing trade, but you should be happy to be out of the market when the trade no longer represents a profitable opportunity.
Most people who learn this do it the hard way. They end up losing all their money before they realize how important it is to love taking a loss. Instead of ignoring the fact that they have a losing trade (like most people do), successful traders confront the possibility of being wrong, and thus, when the time comes to take a loss, they do it without hesitation. I think the reason that so many people have trouble getting out of their losing trades is because they think the losing trade is a reflection of themself. Nothing could be further from the truth. Your losing trades do not diminish you as a person. You are not your losing trades. You are also not your winning trades either. They are simply by-products of the business that you’re in.
Losing trades are part of trading. The most successful traders in the world have losing trades each and every day. They do not get caught up in thinking that the losing trade is part of them. They realize it’s just part of trading, and the sooner they get rid of the losing trade, the faster they can look for the next opportunity to find a winning trade. This is easier said than done, but nevertheless, it’s still the reality of how to make money trading.
I have a friend who’s been an S&P floor trader for over 15 years. He is probably one of the 5 best traders in the S&P pit. He’s also probably one of the 25 best floor traders in the world. The house he lives in has 14 bedrooms and a 6-car garage. So, obviously, he does pretty well with his trading.
He has literally thousands and thousand of dollars in losing trades almost each day. He probably has more money in losing trades each day than most people make in a month. Obviously, he has many thousands of dollars in winning trades also. The point is he has learned to realize that having losing trades is part of the game, and he knows the quicker he can get rid of the losing trades, the sooner he can find some winning trades. It will be the same for you, but only on a smaller scale.
One thing you’ll need to learn is why it’s so important to confront the possibility of a losing trade. If you don’t, you will generate fear and end of up with the very situation you are trying to avoid. When you can learn to understand this concept, only then can you prevent your losing trades from becoming unmanageable and, quite possibly, from wiping out your entire account.
 |
| Realistic Goals |
Mark Douglas, author of The Disciplined Trader states, “Execute your losing trades immediately upon perception that they exist. When losses are predefined and executed without hesitation, there is nothing to consider, weigh, or judge and consequently nothing to tempt yourself with. There will be no threat of allowing yourself the possibility of ultimate disaster. If you find yourself considering, weighing, or judging, then you are either not predefining what a loss is or you are not executing them immediately upon perception, in which case, if you don’t and it turns out to be profitable, you are reinforcing an inappropriate behavior that will inevitably lead to disaster. Or, if you don’t and the loss worsens, you will create a negative cycle of pain, that once started will be difficult to stop.”
He goes on to say, “Keep in mind that fear is really the only thing that keeps us from learning anything new. You can’t learn anything new about the nature of the market’s behavior if you are afraid of what you may do or can’t do that is not in your best interests. By predefining and cutting your losses short, you are making yourself available to learn the best possible way to let your profits grow.”
If you can change what these losses mean to you and realize that getting out of a losing trade as soon as you define it as such, you will be able to release yourself from the stress that those losing trades probably cause you now. This is why learning to love taking a loss is so important. It puts you in a much better position to take the winning trades.
Sunday, December 30, 2012
METHOD—TECHNICAL ANALYSIS
Will this stock rise or fall? Should you go long or short? Traders reachfor a multitude of tools to find answers to these questions. Many tie themselves into knots trying to choose between pattern recognition, computerized indicators, artificial intelligence, or even astrology for some desperate souls. No one can learn all the analytic methods, just as no one can master every field of medicine. A physician cannot become a specialist in heart surgery, obstetrics, and psychiatry. No trader can know everything about the markets. You have to find a niche that attracts you and specialize in it.
Markets emit huge volumes of information. Our tools help organize these flows into a manageable form. It is important to select analytic tools and techniques that make sense to you, put them together into a coherent system, and focus on money management. When we make our trading decisions at the right edge of the chart, we deal with probabilities, not certainties. If you want certainty, go to the middle of the chart and try to find a broker who will accept your orders.
This chapter on technical analysis shows how one trader goes about analyzing markets. Use it as a model for choosing your favorite tools, rather than following it slavishly. Test any method you like on your own data because only personal testing will convert information into knowledge and make these methods your own. Many concepts in this book are illustrated with charts. I selected them from a broad range of markets—stocks as well as futures. Technical analysis is a universal language, even though the accents differ. You can apply what you’ve learned from the chart of IBM to silver or Japanese yen. I trade mostly in the United States, but have used the same methods in Germany.
Russia, Singapore, and Australia. Knowing the language of technical analysis enables you to read any market in the world. Analysis is hard, but trading is much harder. Charts reflect what has happened. Indicators reveal the balance of power between bulls and bears. Analysis is not an end in itself, unless you get a job as an analyst for a company. Our job as traders is to make decisions to buy, sell, or stand aside on the basis of our analysis. After reviewing each chart, you need to go to its hard right edge and decide whether to bet on bulls, bet on bears, or stand aside. You must follow up chart analysis by establishing profit targets, setting stops, and applying money management rules.
BASIC CHARTING
A trade is a bet on a price change. You can make money buying low and selling high or shorting high and covering low. Prices are central to our enterprise, yet few traders stop to think what prices are. What exactly are we trying to analyze?
Financial markets consist of huge crowds of people who meet on the floor of an exchange, on the phone, or via the Internet. We can divide them into three groups: buyers, sellers, and undecided traders. Buyers want to buy as cheaply as possible. Sellers want to sell as expensively as possible. They could take forever to negotiate, but feel pressure from undecided traders. They have to act quickly, before some undecided trader makes up his mind, jumps into the game, and takes away their bargain. Undecided traders are the force that speeds up trading. They are true market participants, as long as they watch the market and have the money to trade it. Each deal is struck in the midst of the market crowd, putting pressure on both buyers and sellers. This is why each trade represents the current emotional state of the entire market crowd. Price is a consensus of value of all market participants expressed in action at the moment of the trade.
Many traders have no clear idea what they are trying to analyze. Balance sheets of companies? Pronouncements of the Federal Reserve? Weather reports from soybean-growing states? The cosmic vibrations of Gann theory? Every chart serves as an ongoing poll of the market. Each tick represents a momentary consensus of value of all market participants. High and low prices, the height of every bar, the angle of every trendline, the duration of every pattern reflect aspects of crowd behavior. Recognizing these patterns can help us decide when to bet on bulls or bears. During an election campaign pollsters call thousands of people asking how they’ll vote. Well-designed polls have predictive value, which is why politicians pay for them. Financial markets run on a two-party system—bulls and bears, with a huge silent majority of undecided traders who may throw their weight to either party. Technical analysis is a poll of market participants.
If bulls are on top, we should cover shorts and go long. If bears are stronger, we should go short. If an election is too close to call, a wise trader stands aside. Standing aside is a legitimate market position and the only one in which you can’t lose money. Individual behavior is difficult to predict. Crowds are much more primitive and their behavior more repetitive and predictable. Our job is not to argue with the crowd, telling it what’s rational or irrational. We need to identify crowd behavior and decide how likely it is to continue. If the trend is up and we find that the crowd is growing more optimistic, we should trade that market from the long side. When we find that the crowd is becoming less optimistic, it is time to sell. If the crowd seems confused, we should stand aside and wait for the market to make up its mind.
The Meaning of Prices
Highs and lows, opening and closing prices, intraday swings and weekly ranges reflect crowd behavior. Our charts, indicators, and technical tools are windows into the mass psychology of the markets. You have to be clear about what you are studying if you want to get closer to the truth. Many market participants have backgrounds in science and engineering and are often tempted to apply the principles of physics. For example, they may try to filter out the noise of a trading range to obtain a clear signal of a trend. Those methods can help, but they cannot be converted into automatic trading systems because the markets are not physical processes. They are reflections of crowd psychology, which follows different, less precise laws. In physics, if you calculate everything, you’ll predict where a process will take you. Not so in the markets, where a crowd can always throw you a curve. Here you have to act within this atmosphere of uncertainty, which is why you must protect yourself with good money management.
The Open The opening price, the first price of the day, is marked on a bar chart by a tick pointing to the left. An opening price reflects the influx of overnight orders. Who placed those orders? A dentist who read a tip in a magazine after dinner, a teacher whose broker touted a trade but who needed his wife’s permission to buy, a financial officer of a slow-moving institution who sat in a meeting all day waiting for his idea to be approved by a committee. They are the people who place orders before the open. Opening prices reflect opinions of less informed market participants.
When outsiders buy or sell, who takes the opposite side of their trades? Market professionals step in to help, only they do not run a charity. If floor traders see more buy orders coming in, they open the market higher, forcing outsiders to overpay. The pros go short, so that the slightest dip makes them money. If the crowd is fearful before the opening and sell orders predominate, the floor opens the market very low. They acquire their goods on the cheap, so that the slightest bounce earns them short-term profits. The opening price establishes the first balance of the day between outsiders and insiders, amateurs and professionals. If you are a short-term trader, pay attention to the opening range—the high and the low of the first 15 to 30 minutes of trading. Most opening ranges are followed by breakouts, which are important because they show who is taking control of the market. Several intraday trading systems are based on following opening range breakouts.
The High Why do prices go up? The standard answer—more buyers than sellers—makes no sense because for every trade there is a buyer and a seller. The market goes up when buyers have more money and are more enthusiastic than sellers. Buyers make money when prices go up. Each uptick adds to their profits. They feel flushed with success, keep buying, call friends and tell them to buy—this thing is going up!Eventually, prices rise to a level where bulls have no more money to spare and some start taking profits. Bears see the market as overpriced and hit it with sales. The market stalls, turns, and begins to fall, leaving behind the high point of the day. That point marks the greatest power of bulls for that day.
The high of every bar reflects the maximum power of bulls during that bar. It shows how high bulls could lift the market during that time period. The high of a daily bar reflects the maximum power of bulls during that day, the high of a weekly bar shows the maximum power of bulls during that week, and the high of a five-minute bar shows their maximum power in those five minutes.
The Low Bears make money when prices fall, with each downtick making money for short sellers. As prices slide, bulls become more and more skittish. They cut back their buying and step aside, figuring they’ll be able to pick up what they want cheaper at a later time. When buyers pull in their horns, it becomes easier for bears to push prices lower, and the decline continues.
It takes money to sell stocks short, and a fall in prices slows down when bears start running low on money. Bullish bargain hunters appear on the scene. Experienced traders recognize what’s happening and start covering shorts and going long. Prices rally from their lows, leaving behind the low mark—the lowest tick of the day. The low point of each bar reflects the maximum power of bears during that bar. The lowest point of a daily bar reflects the maximum power of bears during that day, the low point of a weekly bar shows the maximum power of bears during that week, and the low of a five-minute bar shows the maximum power of bears during those five minutes. Several years ago I designed an indicator, called Elder-ray, for tracking the relative power of bulls and bears by measuring how far the high and the low of each bar get away from the average price.
The Close The closing price is marked on a bar chart by a tick pointing to the right. It reflects the final consensus of value for the day. This is the price at which most people look in their daily newspapers. It is especially important in the futures markets, because the settlement of trading accounts depends on it. Professional traders monitor markets throughout the day. Early in the day they take advantage of opening prices, selling high openings and buying low openings, and then unwinding those positions. Their normal mode of operations is to fade—trade against—market extremes and for the return to normalcy. When prices reach a new high and stall, professionals sell, nudging the market down. When prices stabilize after a fall, they buy, helping the market rally. The waves of buying and selling by amateurs that hit the market at the opening usually subside as the day goes on. Outsiders have done what they planned to do, and near the closing time the market is dominated by professional traders.
Closing prices reflect the opinions of professionals. Look at any chart, and you’ll see how often the opening and closing ticks are at the opposite ends of a price bar. This is because amateurs and professionals tend to be on the opposite sides of trades. Candlesticks and Point and Figure Bar charts are most widely used for tracking prices, but there are other methods. Candlestick charts became popular in the West in the 1990s. Each candle represents a day of trading with a body and two wicks, one above and another below. The body reflects the spread between the opening and closing prices. The tip of the upper wick reaches the highest price of the day and the lower wick the lowest price of the day. Candlestick chartists believe that the relationship between the opening and closing prices is the most important piece of daily data. If prices close higher than they opened, the body of the candle is white, but if prices close lower, the body is black.
The height of a candle body and the length of its wicks reflect the battles between bulls and bears. Those patterns, as well as patterns for med by several neighboring candles, provide useful insights into the power struggle in the markets and can help us decide whether to go long or short. The trouble with candles is they are too fat. I can glance at a computer screen with a bar chart and see five to six months of daily data, without squeezing the scale. Put a candlestick chart in the same space, and you’ll be lucky to get two months of data on the screen. Ultimately, a candlestick chart doesn’t reveal anything more than a bar chart. If you draw a normal bar chart and pay attention to the relationships of opening and closing prices, augmenting that with several technical indicators, you’ll be able to read the markets just as well and perhaps better. Candlestick charts are useful for some but not all traders. If you like them, use them. If not, focus on your bar charts and don’t worry about missing something essential.
Point and figure (P&F) charts are based solely on prices, ignoring volume. They differ from bar and candlestick charts by having no horizontal time scale. When markets become inactive, P&F charts stop drawing because they add a new column of X’s and O’s only when prices change beyond a certain trigger point. P&F charts make congestion areas stand out, helping traders find support and resistance and providing targets for reversals and profit taking. P&F charts are much older than bar charts. Professionals in the pits sometimes scribble them on the backs of their trading decks.
Choosing a chart is a matter of personal choice. Pick the one that feels most comfortable. I prefer bar charts but know many serious traders who like P&F charts or candlestick charts.
The Reality of the Chart
Price ticks coalesce into bars, and bars into patterns, as the crowd writes its emotional diary on the screen. Successful traders learn to recognize a few patterns and trade them. They wait for a familiar pattern to emerge like fishermen wait for a nibble at a riverbank where they fished many times in the past. Many amateurs jump from one stock to another, but professionals tend to trade the same markets for years. They learn their intended catch’s personality, its habits and quirks. When professionals see a short-term bottom in a familiar stock, they recognize a bargain and buy. Their buying checks the decline and pushes the stock up. When prices rise, the pros reduce their buying, but amateurs rush in, sucked in by the good news. When markets become overvalued, professionals start unloading their inventory.
Their selling checks the rise and pushes the market down. Amateurs become spooked and start dumping their holdings, accelerating the decline. Once weak holders have been shaken out, prices slide to the level where professionals see a bottom, and the cycle repeats. That cycle is not mathematically perfect, which is why mechanical systems tend not to work. Using technical indicators requires judgment. Before we review specific chart patterns, let us agree on the basic definitions: An uptrend is a pattern in which most rallies reach a higher point than the preceding rally; most declines stop at a higher level than the preceding decline.
A downtrend is a pattern in which most declines fall to a lower point than the preceding decline; most rallies rise to a lower level than the preceding rally. An uptrendline is a line connecting two or more adjacent bottoms, slanting upwards; if we draw a line parallel to it across the tops, we’ll have a trading channel.
A downtrendline is a line connecting two or more adjacent tops, slanting down; one can draw a parallel line across the bottoms, marking a trading channel.
Support is marked by a horizontal line connecting two or more adjacent bottoms. One can often draw a parallel line across the tops, marking a trading range. sistance is marked by a horizontal line connecting two or more adjacent tops. One can often draw a parallel line below, across the bottoms, to mark a trading range. Tops and Bottoms The tops of rallies mark the areas of the maximum power of bulls. They would love to lift prices even higher and make more money, but that’s where they get overpowered by bears. The bottoms of declines, on the other hands, are the areas of maximum power of bears. They would love to push prices even lower and profit from short positions, but they get overpowered by bulls. Use a computer or a ruler to draw a line connecting nearby tops. If it slants up, it shows that bulls are becoming stronger which is a good thing to know if you plan to trade from the long side. If that line slants down, it shows that bulls are becoming weaker and buying is not such a good idea.
Trendlines applied to market bottoms help visualize changes in the power of bears. When a line connecting two nearby bottoms slants down, it shows that bears are growing stronger, and short selling is a good option. If that line slants up, however it shows that bear are becoming weaker. Uptrendlines and Downtrendlines Prices often appear to travel along invisible roads. When peaks rise higher at each successive rally, prices are in an uptrend. When bottoms keep falling lower and lower, prices are in a downtrend.
We can identify uptrends by drawing trendlines connecting the bottoms of declines. We use bottoms to identify an uptrend because the peaks of rallies tend to be expansive, uneven affairs during uptrends. The declines tend to be more orderly, and when you connect them with a trendline, you get a truer picture of that uptrend. We identify downtrends by drawing trendlines across the peaks of rallies. Each new low in a downtrend tends to be lower than the preceding low, but the panic among weak holders can make bottoms irregularly sharp. Drawing a downtrendline across the tops of rallies paints a more correct picture of that downtrend. The most important feature of a trendline is the direction of its slope.
When it rises, the bulls are in control, and when it declines, the bears are in charge. The longer the trendline and the more points of contact it has with prices, the more valid it is. The angle of a trendline reflects the emotional temperature of the crowd. Quiet, shallow trends can last a long time. As trends accelerate, trendlines have to be redrawn, making them steeper. When they rise or fall at 60° or more, their breaks tend to lead to major reversals. This sometimes happens near the tail ends of runaway moves.
You can plot these lines using a ruler or a computer. It is better to draw trendlines as well as support and resistance lines across the edges of congestion areas instead of price extremes. Congestion areas reflect crowd behavior, while the extreme points show only the panic among the weakest crowd members. Tails—The Kangaroo Pattern Trends take a long time to form, but tails are created in just a few days. They provide valuable insights into market psychology, mark reversal areas, and point to trading opportunities. A tail is a one-day spike in the direction of a trend, followed by a reversal. It takes a minimum of three bars to create a tail—relatively narrow bars in the beginning and at the end, with an extremely wide bar in the middle. That middle bar is the tail, but you won’t know for sure until the following day, when a bar has sharply narrowed back at the base, letting the tail hang out. A tail sticks out from a tight weave of prices—you can’t miss it.
A kangaroo, unlike a horse or a dog, propels itself by pushing with its tail. You can always tell which way a kangaroo is going to jump—opposite its tail. When the tail points north, the kangaroo jumps south, and when the tail points south, it jumps north. Market tails tend to occur at turning points in the markets, which recoil from them like kangaroos recoil from their tails. A tail does not forecast the extent of a move, but the first jump usually lasts a few days, offering a trading opportunity. You can do well by recognizing tails and trading against them. Before you trade any pattern, you must understand what it tells you about the market. Why do markets jump away from their tails? Exchanges are owned by members who profit from volume rather than trends. Markets fluctuate, looking for price levels that will bring the highest volume of orders. Members do not know where those levels are, but they keep probing higher and lower. A tail shows that the market has tested a certain price level and rejected it.
If a market stabs down and recoils, it shows that lower prices do not attract volume. The natural thing for the market to do next is rally and test higher levels to see whether higher prices will bring more volume. If the market stabs higher and recoils, leaving a tail pointing upward, it shows that higher prices do not attract volume. The members are likely to sell the market down in order to find whether lower prices will attract volume. Tails work because the owners of the market are looking to maximize income. Whenever you see a very tall bar (several times the average for recent months) shooting in the direction of the existing trend, be alert to the possibility of a tail. If the following day the market traces a very narrow bar at the base of the tall bar, it completes a tail. Be ready to put on a position, trading against that tail, before the close.
When a market hangs down a tail, go long in the vicinity of the base of that tail. Once long, place a protective stop approximately half-way down the tail. If the market starts chewing its tail, run without delay. The targets for profit taking on these long positions are best established by using moving averages and channels (see “Indicators—Five Bullets to a Clip,” page 84). When a market puts up a tail, go short in the area of the base of that tail. Once short, place a protective stop approximately half-way up the tail. If the market starts rallying up its tail, it is time to run; do not wait for the entire tail to be chewed up. Establish profit-taking targets using moving averages and channels. You can trade against tails in any timeframe. Daily charts are most common, but you can also trade them on intraday or weekly charts. The magnitude of a move depends on its timeframe. A tail on a weekly chart will generate a much bigger move than a tail on a five-minute chart.
Support, Resistance, and False Breakouts When most traders and investors buy and sell, they make an emotional as well as a financial commitment to their trade. Their emotions can propel market trends or send them into reversals.
The longer a market trades at a certain level, the more people buy and sell. Suppose a stock falls from 80 and trades near 70 for several weeks, until many believe that it has found support and reached its bottom. What happens if heavy selling comes in and shoves that stock down to 60? Smart longs will run fast, banging out at 69 or 68. Others will sit through the entire painful decline. If losers haven’t given up near 60 and are still alive when the market trades back towards 70, their pain will prompt them to jump at a chance to “get out even.” Their selling is likely to cap a rally, at least temporarily. Their painful memories are the reason why the areas that served as support on the way down become resistance on the way up, and vice versa.
Regret is another psychological force behind support and resistance. If a stock trades at 80 for a while and then rallies to 95, those who did not buy it near 80 feel as if they missed the train. If that stock sinks back near 80, traders who regret a missed opportunity will return to buy in force. Support and resistance can remain active for months or even years because investors have long memories. When prices return to their old levels, some jump at the opportunity to add to their positions while others see a chance to get out. Whenever you work with a chart, draw support and resistance lines across recent tops and bottoms. Expect a trend to slow down in those areas, and use them to enter positions or take profits. Keep in mind that support and resistance are flexible—they are like a ranch wire fence rather than a glass wall. A glass wall is rigid and shatters when broken, but a herd of bulls can push against a wire fence, shove their muzzles through it, and it will lean but stand. Markets have many false breakouts below support and above resistance, with prices returning into their range after a brief violation.
A false upside breakout occurs when the market rises above resistance and sucks in buyers before reversing and falling. A false downside breakout occurs when prices fall below support, attracting more bears just before a rally. False breakouts provide professionals with some of the best trading opportunities. They are similar to tails, only tails have a single wide bar, whereas false breakouts can have several bars, none of them especially tall. What causes false breakouts and how do you trade them? At the end of a long rise the market hits resistance, stops, and starts churning. The professionals know there are many more buy orders above the resistance level. Some were placed by traders looking to buy a new breakout, and others are protective stops placed by those who went short on the way up. The pros are the first to know where people have stops because they are the ones holding the orders.
A false breakout occurs when the pros organize a fishing expedition to run stops. For example, when a stock is slightly below its resistance at 60, the floor may start loading up on longs near 58.85. As sellers pull back, the market roars above 60, setting off buy stops. The floor starts selling into that rush, unloading longs as prices touch 60.50. When they see that public buy orders are drying up, they sell short and prices tank back below 60. That’s when your charts show a false breakout above 60. S&P 500 futures are notorious for false breakouts. Day after day this market exceeds its previous day’s high or falls below its previous day’s low by a few ticks (a tick is the minimum price change permitted by the exchange where an instrument is traded). This is one of the reasons the S&P is a difficult market to trade, but it attracts beginners like flies. The floor has a field day slapping them.
Some of the best trading opportunities occur after false breakouts. When prices fall back into the range after a false upside breakout, you have extra confidence to trade short. Use the top of the false breakout as your stoploss point. Once prices rally back into their range after a false downside breakout, you have extra confidence to trade long. Use the bottom of that false breakout for your stop-loss point. If you have an open position, defend yourself against false breakouts by reducing your trading size and placing wider stops. Be ready to reposition if stopped out of your trade. There are many advantages to risking just a small fraction of your account on any trade. It allows you to be more flexible with stops. When the volatility is high, consider protecting a long position by buying a put or a short position by buying a call. Finally, if you get stopped out on a false breakout, don’t be shy about getting back into a trade. Beginners tend to make a single stab at a position and stay out if they are stopped out. Professionals, on the other hand, will attempt several entries before nailing down the trade they want. Double Tops and Bottoms Bulls make money when the market rises. There are always a few who take profits on the way up, but new bulls come in and the rally continues. Every rally reaches a point where enough bulls look at it and say—this is very nice, and it may get even nicer, but I’d rather have cash. Rallies top out after enough wealthy bulls take their profits, while the money from new bulls is not enough to replace what was taken out.
When the market heads down from its peak, savvy bulls, the ones who’ve cashed out early, are the most relaxed group. Other bulls who are still long, especially if they came in late, feel trapped. Their profits are melting away and turning into losses. Should they hold or sell? If enough moneyed bulls decide the decline is being overdone, they’ll step in and buy. As the rally resumes, more bulls come in. Now prices approach the level of their old top, and that’s where you can expect sell orders to hit the market. Many traders who got caught in the previous decline swear to get out if the market gives them a second chance. As the market rises toward its previous peak, the main question is whether it will it rise to a new high or form a double top and turn down. Technical indicators can be of great help in answering this question. When they rise to a new high, they tell you to hold, and when they form bearish divergences, they tell you to take profits at the second top.
A mirror image of this situation occurs at market bottoms. The market falls to a new low at which enough smart bears start covering shorts and the market rallies. Once that rally peters out and prices start sinking again, all eyes are on the previous low—will it hold? If bears are strong and bulls skittish, prices will break below the first low, and the downtrend will continue. If bears are weak and bulls are strong, the decline will stop in the vicinity of the old low, creating a double bottom. Technical indicators help decipher which of the two is more likely to happen. Triangles A triangle is a congestion area, a pause when winners take profits and new trend followers get aboard, while their opponents trade against the preceding trend. It is like a train station. The train stops to let passengers off and pick up new ones, but there is always a chance this is the last stop on the line and it may turn back. The upper boundary of a triangle shows where sellers overpower buyers and prevent the market from rising. The lower boundary shows where buyers overpower sellers and prevent the market from falling. As the two start to converge, you know a breakout is coming. As a general rule, the trend that preceded the triangle deserves the benefit of the doubt. The angles between triangle walls reflect the balance of power between bulls and bears and hint at the likely direction of a breakout.
An ascending triangle has a flat upper boundary and a rising lower boundary. The flat upper line shows that bears have drawn a line in the sand and sell whenever the market comes to it. They must be a pretty powerful group, calmly waiting for prices to come to them before unloading. At the same time buyers are becoming more aggressive. They snap up merchandise and keep raising the floor under the market. On what party should you bet? Nobody knows who’ll win the election, but savvy traders tend to place buy orders slightly above the upper line of an ascending triangle. Since sellers are on the defensive, if the attacking bulls succeed, the breakout is likely to be steep. This is the logic of buying upside breakouts from ascending triangles.
A descending triangle has a flat lower boundary and a declining upper boundary. The horizontal lower line shows that bulls are pretty determined, calmly waiting to buy at a certain level. At the same time, sellers are becoming more aggressive. They keep selling at lower and lower levels, pushing the market closer to the line drawn by buyers. As a trader, which way will you bet—on the bulls or the bears? Experienced traders tend to place their orders to sell short slightly below the lower line of a descending triangle. Let buyers defend that line, but if bulls collapse after a long defense, a break is likely to be sharp. This is the logic of shorting downside breakouts from descending triangles. A symmetrical triangle shows that both bulls and bears are equally confident. Bulls keep paying up, and bears keep selling lower. Neither group is backing off, and their fight must be resolved before prices reach the tip of the triangle. The breakout is likely to go in the direction of the trend that preceded the triangle. Volume Each unit of volume represents the actions of two individuals—a buyer and a seller. It can be measured by several numbers: shares, contracts, or dollars that have changed hands. Volume is usually plotted as a histogram below prices. It provides important clues about the actions of bulls and bears. Rising volume tends to confirm trends, and falling volume brings them into question.
Volume reflects the level of pain among market participants. At each tick in every trade, one person is winning and the other losing. Markets can move only if enough new losers enter the game to supply profits to winners. If the market is falling, it takes a very courageous or reckless bull to step in and buy, but without him there is no increase in volume. When the trend is up, it takes a very brave or reckless bear to step in and sell. Rising volume shows that losers are continuing to come in, allowing the trend to continue. When losers start abandoning the market, volume falls, and the trend runs out of steam. Volume gives traders several useful clues. A one-day splash of uncommonly high volume often marks the beginning of a trend when it accompanies a breakout from a trading range. A similar splash tends to mark the end of a trend if it occurs during a wellestablished move. Exceedingly high volume, three or more times above average, identifies market hysteria. That is when nervous bulls finally decide that the uptrend is for real and rush in to buy or nervous bears become convinced that the decline has no bottom and jump in to sell short.
Markets emit huge volumes of information. Our tools help organize these flows into a manageable form. It is important to select analytic tools and techniques that make sense to you, put them together into a coherent system, and focus on money management. When we make our trading decisions at the right edge of the chart, we deal with probabilities, not certainties. If you want certainty, go to the middle of the chart and try to find a broker who will accept your orders.
This chapter on technical analysis shows how one trader goes about analyzing markets. Use it as a model for choosing your favorite tools, rather than following it slavishly. Test any method you like on your own data because only personal testing will convert information into knowledge and make these methods your own. Many concepts in this book are illustrated with charts. I selected them from a broad range of markets—stocks as well as futures. Technical analysis is a universal language, even though the accents differ. You can apply what you’ve learned from the chart of IBM to silver or Japanese yen. I trade mostly in the United States, but have used the same methods in Germany.
Russia, Singapore, and Australia. Knowing the language of technical analysis enables you to read any market in the world. Analysis is hard, but trading is much harder. Charts reflect what has happened. Indicators reveal the balance of power between bulls and bears. Analysis is not an end in itself, unless you get a job as an analyst for a company. Our job as traders is to make decisions to buy, sell, or stand aside on the basis of our analysis. After reviewing each chart, you need to go to its hard right edge and decide whether to bet on bulls, bet on bears, or stand aside. You must follow up chart analysis by establishing profit targets, setting stops, and applying money management rules.
BASIC CHARTING
A trade is a bet on a price change. You can make money buying low and selling high or shorting high and covering low. Prices are central to our enterprise, yet few traders stop to think what prices are. What exactly are we trying to analyze?
 |
| Technical Analysis |
Many traders have no clear idea what they are trying to analyze. Balance sheets of companies? Pronouncements of the Federal Reserve? Weather reports from soybean-growing states? The cosmic vibrations of Gann theory? Every chart serves as an ongoing poll of the market. Each tick represents a momentary consensus of value of all market participants. High and low prices, the height of every bar, the angle of every trendline, the duration of every pattern reflect aspects of crowd behavior. Recognizing these patterns can help us decide when to bet on bulls or bears. During an election campaign pollsters call thousands of people asking how they’ll vote. Well-designed polls have predictive value, which is why politicians pay for them. Financial markets run on a two-party system—bulls and bears, with a huge silent majority of undecided traders who may throw their weight to either party. Technical analysis is a poll of market participants.
If bulls are on top, we should cover shorts and go long. If bears are stronger, we should go short. If an election is too close to call, a wise trader stands aside. Standing aside is a legitimate market position and the only one in which you can’t lose money. Individual behavior is difficult to predict. Crowds are much more primitive and their behavior more repetitive and predictable. Our job is not to argue with the crowd, telling it what’s rational or irrational. We need to identify crowd behavior and decide how likely it is to continue. If the trend is up and we find that the crowd is growing more optimistic, we should trade that market from the long side. When we find that the crowd is becoming less optimistic, it is time to sell. If the crowd seems confused, we should stand aside and wait for the market to make up its mind.
The Meaning of Prices
Highs and lows, opening and closing prices, intraday swings and weekly ranges reflect crowd behavior. Our charts, indicators, and technical tools are windows into the mass psychology of the markets. You have to be clear about what you are studying if you want to get closer to the truth. Many market participants have backgrounds in science and engineering and are often tempted to apply the principles of physics. For example, they may try to filter out the noise of a trading range to obtain a clear signal of a trend. Those methods can help, but they cannot be converted into automatic trading systems because the markets are not physical processes. They are reflections of crowd psychology, which follows different, less precise laws. In physics, if you calculate everything, you’ll predict where a process will take you. Not so in the markets, where a crowd can always throw you a curve. Here you have to act within this atmosphere of uncertainty, which is why you must protect yourself with good money management.
The Open The opening price, the first price of the day, is marked on a bar chart by a tick pointing to the left. An opening price reflects the influx of overnight orders. Who placed those orders? A dentist who read a tip in a magazine after dinner, a teacher whose broker touted a trade but who needed his wife’s permission to buy, a financial officer of a slow-moving institution who sat in a meeting all day waiting for his idea to be approved by a committee. They are the people who place orders before the open. Opening prices reflect opinions of less informed market participants.
 |
| Trade Chart |
The High Why do prices go up? The standard answer—more buyers than sellers—makes no sense because for every trade there is a buyer and a seller. The market goes up when buyers have more money and are more enthusiastic than sellers. Buyers make money when prices go up. Each uptick adds to their profits. They feel flushed with success, keep buying, call friends and tell them to buy—this thing is going up!Eventually, prices rise to a level where bulls have no more money to spare and some start taking profits. Bears see the market as overpriced and hit it with sales. The market stalls, turns, and begins to fall, leaving behind the high point of the day. That point marks the greatest power of bulls for that day.
The high of every bar reflects the maximum power of bulls during that bar. It shows how high bulls could lift the market during that time period. The high of a daily bar reflects the maximum power of bulls during that day, the high of a weekly bar shows the maximum power of bulls during that week, and the high of a five-minute bar shows their maximum power in those five minutes.
The Low Bears make money when prices fall, with each downtick making money for short sellers. As prices slide, bulls become more and more skittish. They cut back their buying and step aside, figuring they’ll be able to pick up what they want cheaper at a later time. When buyers pull in their horns, it becomes easier for bears to push prices lower, and the decline continues.
It takes money to sell stocks short, and a fall in prices slows down when bears start running low on money. Bullish bargain hunters appear on the scene. Experienced traders recognize what’s happening and start covering shorts and going long. Prices rally from their lows, leaving behind the low mark—the lowest tick of the day. The low point of each bar reflects the maximum power of bears during that bar. The lowest point of a daily bar reflects the maximum power of bears during that day, the low point of a weekly bar shows the maximum power of bears during that week, and the low of a five-minute bar shows the maximum power of bears during those five minutes. Several years ago I designed an indicator, called Elder-ray, for tracking the relative power of bulls and bears by measuring how far the high and the low of each bar get away from the average price.
The Close The closing price is marked on a bar chart by a tick pointing to the right. It reflects the final consensus of value for the day. This is the price at which most people look in their daily newspapers. It is especially important in the futures markets, because the settlement of trading accounts depends on it. Professional traders monitor markets throughout the day. Early in the day they take advantage of opening prices, selling high openings and buying low openings, and then unwinding those positions. Their normal mode of operations is to fade—trade against—market extremes and for the return to normalcy. When prices reach a new high and stall, professionals sell, nudging the market down. When prices stabilize after a fall, they buy, helping the market rally. The waves of buying and selling by amateurs that hit the market at the opening usually subside as the day goes on. Outsiders have done what they planned to do, and near the closing time the market is dominated by professional traders.
Closing prices reflect the opinions of professionals. Look at any chart, and you’ll see how often the opening and closing ticks are at the opposite ends of a price bar. This is because amateurs and professionals tend to be on the opposite sides of trades. Candlesticks and Point and Figure Bar charts are most widely used for tracking prices, but there are other methods. Candlestick charts became popular in the West in the 1990s. Each candle represents a day of trading with a body and two wicks, one above and another below. The body reflects the spread between the opening and closing prices. The tip of the upper wick reaches the highest price of the day and the lower wick the lowest price of the day. Candlestick chartists believe that the relationship between the opening and closing prices is the most important piece of daily data. If prices close higher than they opened, the body of the candle is white, but if prices close lower, the body is black.
The height of a candle body and the length of its wicks reflect the battles between bulls and bears. Those patterns, as well as patterns for med by several neighboring candles, provide useful insights into the power struggle in the markets and can help us decide whether to go long or short. The trouble with candles is they are too fat. I can glance at a computer screen with a bar chart and see five to six months of daily data, without squeezing the scale. Put a candlestick chart in the same space, and you’ll be lucky to get two months of data on the screen. Ultimately, a candlestick chart doesn’t reveal anything more than a bar chart. If you draw a normal bar chart and pay attention to the relationships of opening and closing prices, augmenting that with several technical indicators, you’ll be able to read the markets just as well and perhaps better. Candlestick charts are useful for some but not all traders. If you like them, use them. If not, focus on your bar charts and don’t worry about missing something essential.
Point and figure (P&F) charts are based solely on prices, ignoring volume. They differ from bar and candlestick charts by having no horizontal time scale. When markets become inactive, P&F charts stop drawing because they add a new column of X’s and O’s only when prices change beyond a certain trigger point. P&F charts make congestion areas stand out, helping traders find support and resistance and providing targets for reversals and profit taking. P&F charts are much older than bar charts. Professionals in the pits sometimes scribble them on the backs of their trading decks.
Choosing a chart is a matter of personal choice. Pick the one that feels most comfortable. I prefer bar charts but know many serious traders who like P&F charts or candlestick charts.
The Reality of the Chart
Price ticks coalesce into bars, and bars into patterns, as the crowd writes its emotional diary on the screen. Successful traders learn to recognize a few patterns and trade them. They wait for a familiar pattern to emerge like fishermen wait for a nibble at a riverbank where they fished many times in the past. Many amateurs jump from one stock to another, but professionals tend to trade the same markets for years. They learn their intended catch’s personality, its habits and quirks. When professionals see a short-term bottom in a familiar stock, they recognize a bargain and buy. Their buying checks the decline and pushes the stock up. When prices rise, the pros reduce their buying, but amateurs rush in, sucked in by the good news. When markets become overvalued, professionals start unloading their inventory.
Their selling checks the rise and pushes the market down. Amateurs become spooked and start dumping their holdings, accelerating the decline. Once weak holders have been shaken out, prices slide to the level where professionals see a bottom, and the cycle repeats. That cycle is not mathematically perfect, which is why mechanical systems tend not to work. Using technical indicators requires judgment. Before we review specific chart patterns, let us agree on the basic definitions: An uptrend is a pattern in which most rallies reach a higher point than the preceding rally; most declines stop at a higher level than the preceding decline.
A downtrend is a pattern in which most declines fall to a lower point than the preceding decline; most rallies rise to a lower level than the preceding rally. An uptrendline is a line connecting two or more adjacent bottoms, slanting upwards; if we draw a line parallel to it across the tops, we’ll have a trading channel.
A downtrendline is a line connecting two or more adjacent tops, slanting down; one can draw a parallel line across the bottoms, marking a trading channel.
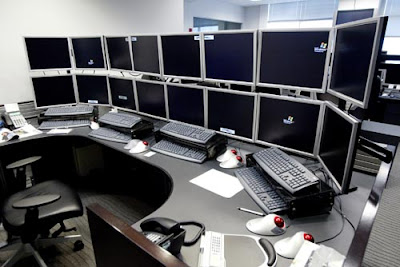 |
| The Reality of The Chart |
Trendlines applied to market bottoms help visualize changes in the power of bears. When a line connecting two nearby bottoms slants down, it shows that bears are growing stronger, and short selling is a good option. If that line slants up, however it shows that bear are becoming weaker. Uptrendlines and Downtrendlines Prices often appear to travel along invisible roads. When peaks rise higher at each successive rally, prices are in an uptrend. When bottoms keep falling lower and lower, prices are in a downtrend.
We can identify uptrends by drawing trendlines connecting the bottoms of declines. We use bottoms to identify an uptrend because the peaks of rallies tend to be expansive, uneven affairs during uptrends. The declines tend to be more orderly, and when you connect them with a trendline, you get a truer picture of that uptrend. We identify downtrends by drawing trendlines across the peaks of rallies. Each new low in a downtrend tends to be lower than the preceding low, but the panic among weak holders can make bottoms irregularly sharp. Drawing a downtrendline across the tops of rallies paints a more correct picture of that downtrend. The most important feature of a trendline is the direction of its slope.
When it rises, the bulls are in control, and when it declines, the bears are in charge. The longer the trendline and the more points of contact it has with prices, the more valid it is. The angle of a trendline reflects the emotional temperature of the crowd. Quiet, shallow trends can last a long time. As trends accelerate, trendlines have to be redrawn, making them steeper. When they rise or fall at 60° or more, their breaks tend to lead to major reversals. This sometimes happens near the tail ends of runaway moves.
You can plot these lines using a ruler or a computer. It is better to draw trendlines as well as support and resistance lines across the edges of congestion areas instead of price extremes. Congestion areas reflect crowd behavior, while the extreme points show only the panic among the weakest crowd members. Tails—The Kangaroo Pattern Trends take a long time to form, but tails are created in just a few days. They provide valuable insights into market psychology, mark reversal areas, and point to trading opportunities. A tail is a one-day spike in the direction of a trend, followed by a reversal. It takes a minimum of three bars to create a tail—relatively narrow bars in the beginning and at the end, with an extremely wide bar in the middle. That middle bar is the tail, but you won’t know for sure until the following day, when a bar has sharply narrowed back at the base, letting the tail hang out. A tail sticks out from a tight weave of prices—you can’t miss it.
A kangaroo, unlike a horse or a dog, propels itself by pushing with its tail. You can always tell which way a kangaroo is going to jump—opposite its tail. When the tail points north, the kangaroo jumps south, and when the tail points south, it jumps north. Market tails tend to occur at turning points in the markets, which recoil from them like kangaroos recoil from their tails. A tail does not forecast the extent of a move, but the first jump usually lasts a few days, offering a trading opportunity. You can do well by recognizing tails and trading against them. Before you trade any pattern, you must understand what it tells you about the market. Why do markets jump away from their tails? Exchanges are owned by members who profit from volume rather than trends. Markets fluctuate, looking for price levels that will bring the highest volume of orders. Members do not know where those levels are, but they keep probing higher and lower. A tail shows that the market has tested a certain price level and rejected it.
If a market stabs down and recoils, it shows that lower prices do not attract volume. The natural thing for the market to do next is rally and test higher levels to see whether higher prices will bring more volume. If the market stabs higher and recoils, leaving a tail pointing upward, it shows that higher prices do not attract volume. The members are likely to sell the market down in order to find whether lower prices will attract volume. Tails work because the owners of the market are looking to maximize income. Whenever you see a very tall bar (several times the average for recent months) shooting in the direction of the existing trend, be alert to the possibility of a tail. If the following day the market traces a very narrow bar at the base of the tall bar, it completes a tail. Be ready to put on a position, trading against that tail, before the close.
When a market hangs down a tail, go long in the vicinity of the base of that tail. Once long, place a protective stop approximately half-way down the tail. If the market starts chewing its tail, run without delay. The targets for profit taking on these long positions are best established by using moving averages and channels (see “Indicators—Five Bullets to a Clip,” page 84). When a market puts up a tail, go short in the area of the base of that tail. Once short, place a protective stop approximately half-way up the tail. If the market starts rallying up its tail, it is time to run; do not wait for the entire tail to be chewed up. Establish profit-taking targets using moving averages and channels. You can trade against tails in any timeframe. Daily charts are most common, but you can also trade them on intraday or weekly charts. The magnitude of a move depends on its timeframe. A tail on a weekly chart will generate a much bigger move than a tail on a five-minute chart.
Support, Resistance, and False Breakouts When most traders and investors buy and sell, they make an emotional as well as a financial commitment to their trade. Their emotions can propel market trends or send them into reversals.
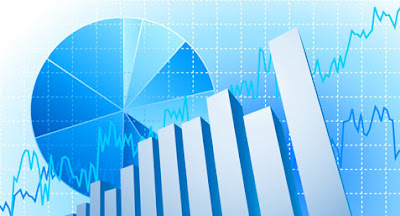 |
| Trend |
Regret is another psychological force behind support and resistance. If a stock trades at 80 for a while and then rallies to 95, those who did not buy it near 80 feel as if they missed the train. If that stock sinks back near 80, traders who regret a missed opportunity will return to buy in force. Support and resistance can remain active for months or even years because investors have long memories. When prices return to their old levels, some jump at the opportunity to add to their positions while others see a chance to get out. Whenever you work with a chart, draw support and resistance lines across recent tops and bottoms. Expect a trend to slow down in those areas, and use them to enter positions or take profits. Keep in mind that support and resistance are flexible—they are like a ranch wire fence rather than a glass wall. A glass wall is rigid and shatters when broken, but a herd of bulls can push against a wire fence, shove their muzzles through it, and it will lean but stand. Markets have many false breakouts below support and above resistance, with prices returning into their range after a brief violation.
A false upside breakout occurs when the market rises above resistance and sucks in buyers before reversing and falling. A false downside breakout occurs when prices fall below support, attracting more bears just before a rally. False breakouts provide professionals with some of the best trading opportunities. They are similar to tails, only tails have a single wide bar, whereas false breakouts can have several bars, none of them especially tall. What causes false breakouts and how do you trade them? At the end of a long rise the market hits resistance, stops, and starts churning. The professionals know there are many more buy orders above the resistance level. Some were placed by traders looking to buy a new breakout, and others are protective stops placed by those who went short on the way up. The pros are the first to know where people have stops because they are the ones holding the orders.
A false breakout occurs when the pros organize a fishing expedition to run stops. For example, when a stock is slightly below its resistance at 60, the floor may start loading up on longs near 58.85. As sellers pull back, the market roars above 60, setting off buy stops. The floor starts selling into that rush, unloading longs as prices touch 60.50. When they see that public buy orders are drying up, they sell short and prices tank back below 60. That’s when your charts show a false breakout above 60. S&P 500 futures are notorious for false breakouts. Day after day this market exceeds its previous day’s high or falls below its previous day’s low by a few ticks (a tick is the minimum price change permitted by the exchange where an instrument is traded). This is one of the reasons the S&P is a difficult market to trade, but it attracts beginners like flies. The floor has a field day slapping them.
Some of the best trading opportunities occur after false breakouts. When prices fall back into the range after a false upside breakout, you have extra confidence to trade short. Use the top of the false breakout as your stoploss point. Once prices rally back into their range after a false downside breakout, you have extra confidence to trade long. Use the bottom of that false breakout for your stop-loss point. If you have an open position, defend yourself against false breakouts by reducing your trading size and placing wider stops. Be ready to reposition if stopped out of your trade. There are many advantages to risking just a small fraction of your account on any trade. It allows you to be more flexible with stops. When the volatility is high, consider protecting a long position by buying a put or a short position by buying a call. Finally, if you get stopped out on a false breakout, don’t be shy about getting back into a trade. Beginners tend to make a single stab at a position and stay out if they are stopped out. Professionals, on the other hand, will attempt several entries before nailing down the trade they want. Double Tops and Bottoms Bulls make money when the market rises. There are always a few who take profits on the way up, but new bulls come in and the rally continues. Every rally reaches a point where enough bulls look at it and say—this is very nice, and it may get even nicer, but I’d rather have cash. Rallies top out after enough wealthy bulls take their profits, while the money from new bulls is not enough to replace what was taken out.
When the market heads down from its peak, savvy bulls, the ones who’ve cashed out early, are the most relaxed group. Other bulls who are still long, especially if they came in late, feel trapped. Their profits are melting away and turning into losses. Should they hold or sell? If enough moneyed bulls decide the decline is being overdone, they’ll step in and buy. As the rally resumes, more bulls come in. Now prices approach the level of their old top, and that’s where you can expect sell orders to hit the market. Many traders who got caught in the previous decline swear to get out if the market gives them a second chance. As the market rises toward its previous peak, the main question is whether it will it rise to a new high or form a double top and turn down. Technical indicators can be of great help in answering this question. When they rise to a new high, they tell you to hold, and when they form bearish divergences, they tell you to take profits at the second top.
A mirror image of this situation occurs at market bottoms. The market falls to a new low at which enough smart bears start covering shorts and the market rallies. Once that rally peters out and prices start sinking again, all eyes are on the previous low—will it hold? If bears are strong and bulls skittish, prices will break below the first low, and the downtrend will continue. If bears are weak and bulls are strong, the decline will stop in the vicinity of the old low, creating a double bottom. Technical indicators help decipher which of the two is more likely to happen. Triangles A triangle is a congestion area, a pause when winners take profits and new trend followers get aboard, while their opponents trade against the preceding trend. It is like a train station. The train stops to let passengers off and pick up new ones, but there is always a chance this is the last stop on the line and it may turn back. The upper boundary of a triangle shows where sellers overpower buyers and prevent the market from rising. The lower boundary shows where buyers overpower sellers and prevent the market from falling. As the two start to converge, you know a breakout is coming. As a general rule, the trend that preceded the triangle deserves the benefit of the doubt. The angles between triangle walls reflect the balance of power between bulls and bears and hint at the likely direction of a breakout.
An ascending triangle has a flat upper boundary and a rising lower boundary. The flat upper line shows that bears have drawn a line in the sand and sell whenever the market comes to it. They must be a pretty powerful group, calmly waiting for prices to come to them before unloading. At the same time buyers are becoming more aggressive. They snap up merchandise and keep raising the floor under the market. On what party should you bet? Nobody knows who’ll win the election, but savvy traders tend to place buy orders slightly above the upper line of an ascending triangle. Since sellers are on the defensive, if the attacking bulls succeed, the breakout is likely to be steep. This is the logic of buying upside breakouts from ascending triangles.
A descending triangle has a flat lower boundary and a declining upper boundary. The horizontal lower line shows that bulls are pretty determined, calmly waiting to buy at a certain level. At the same time, sellers are becoming more aggressive. They keep selling at lower and lower levels, pushing the market closer to the line drawn by buyers. As a trader, which way will you bet—on the bulls or the bears? Experienced traders tend to place their orders to sell short slightly below the lower line of a descending triangle. Let buyers defend that line, but if bulls collapse after a long defense, a break is likely to be sharp. This is the logic of shorting downside breakouts from descending triangles. A symmetrical triangle shows that both bulls and bears are equally confident. Bulls keep paying up, and bears keep selling lower. Neither group is backing off, and their fight must be resolved before prices reach the tip of the triangle. The breakout is likely to go in the direction of the trend that preceded the triangle. Volume Each unit of volume represents the actions of two individuals—a buyer and a seller. It can be measured by several numbers: shares, contracts, or dollars that have changed hands. Volume is usually plotted as a histogram below prices. It provides important clues about the actions of bulls and bears. Rising volume tends to confirm trends, and falling volume brings them into question.
Volume reflects the level of pain among market participants. At each tick in every trade, one person is winning and the other losing. Markets can move only if enough new losers enter the game to supply profits to winners. If the market is falling, it takes a very courageous or reckless bull to step in and buy, but without him there is no increase in volume. When the trend is up, it takes a very brave or reckless bear to step in and sell. Rising volume shows that losers are continuing to come in, allowing the trend to continue. When losers start abandoning the market, volume falls, and the trend runs out of steam. Volume gives traders several useful clues. A one-day splash of uncommonly high volume often marks the beginning of a trend when it accompanies a breakout from a trading range. A similar splash tends to mark the end of a trend if it occurs during a wellestablished move. Exceedingly high volume, three or more times above average, identifies market hysteria. That is when nervous bulls finally decide that the uptrend is for real and rush in to buy or nervous bears become convinced that the decline has no bottom and jump in to sell short.
Subscribe to:
Posts (Atom)
Popular Posts
-
 LEARNING TO LOVE TO TAKE A LOSS I realized early on in my trading career that one of the most common characteristics in almost all su...
 -
 Will this stock rise or fall? Should you go long or short? Traders reachfor a multitude of tools to find answers to these questions. Many t...
 -
Bad Luck People who like to complain about their bad luck are often experts in looking for trouble and snatching defeat from the jaws ...
-
Many people give little thought to life’s important decisions. They stumble into them by accidents of geography, time, or chance. Where to ...
-
Are traders born or made? There is no simple answer. Both aptitude and learning are important, but in different proportions for different p...
-
 A successful trader is like a fish swimming upstream, against the current. Commissions, slippage, and expenses keep pushing you back. You m...


