Sunday, December 30, 2012
METHOD—TECHNICAL ANALYSIS
Will this stock rise or fall? Should you go long or short? Traders reachfor a multitude of tools to find answers to these questions. Many tie themselves into knots trying to choose between pattern recognition, computerized indicators, artificial intelligence, or even astrology for some desperate souls. No one can learn all the analytic methods, just as no one can master every field of medicine. A physician cannot become a specialist in heart surgery, obstetrics, and psychiatry. No trader can know everything about the markets. You have to find a niche that attracts you and specialize in it.
Markets emit huge volumes of information. Our tools help organize these flows into a manageable form. It is important to select analytic tools and techniques that make sense to you, put them together into a coherent system, and focus on money management. When we make our trading decisions at the right edge of the chart, we deal with probabilities, not certainties. If you want certainty, go to the middle of the chart and try to find a broker who will accept your orders.
This chapter on technical analysis shows how one trader goes about analyzing markets. Use it as a model for choosing your favorite tools, rather than following it slavishly. Test any method you like on your own data because only personal testing will convert information into knowledge and make these methods your own. Many concepts in this book are illustrated with charts. I selected them from a broad range of markets—stocks as well as futures. Technical analysis is a universal language, even though the accents differ. You can apply what you’ve learned from the chart of IBM to silver or Japanese yen. I trade mostly in the United States, but have used the same methods in Germany.
Russia, Singapore, and Australia. Knowing the language of technical analysis enables you to read any market in the world. Analysis is hard, but trading is much harder. Charts reflect what has happened. Indicators reveal the balance of power between bulls and bears. Analysis is not an end in itself, unless you get a job as an analyst for a company. Our job as traders is to make decisions to buy, sell, or stand aside on the basis of our analysis. After reviewing each chart, you need to go to its hard right edge and decide whether to bet on bulls, bet on bears, or stand aside. You must follow up chart analysis by establishing profit targets, setting stops, and applying money management rules.
BASIC CHARTING
A trade is a bet on a price change. You can make money buying low and selling high or shorting high and covering low. Prices are central to our enterprise, yet few traders stop to think what prices are. What exactly are we trying to analyze?
Financial markets consist of huge crowds of people who meet on the floor of an exchange, on the phone, or via the Internet. We can divide them into three groups: buyers, sellers, and undecided traders. Buyers want to buy as cheaply as possible. Sellers want to sell as expensively as possible. They could take forever to negotiate, but feel pressure from undecided traders. They have to act quickly, before some undecided trader makes up his mind, jumps into the game, and takes away their bargain. Undecided traders are the force that speeds up trading. They are true market participants, as long as they watch the market and have the money to trade it. Each deal is struck in the midst of the market crowd, putting pressure on both buyers and sellers. This is why each trade represents the current emotional state of the entire market crowd. Price is a consensus of value of all market participants expressed in action at the moment of the trade.
Many traders have no clear idea what they are trying to analyze. Balance sheets of companies? Pronouncements of the Federal Reserve? Weather reports from soybean-growing states? The cosmic vibrations of Gann theory? Every chart serves as an ongoing poll of the market. Each tick represents a momentary consensus of value of all market participants. High and low prices, the height of every bar, the angle of every trendline, the duration of every pattern reflect aspects of crowd behavior. Recognizing these patterns can help us decide when to bet on bulls or bears. During an election campaign pollsters call thousands of people asking how they’ll vote. Well-designed polls have predictive value, which is why politicians pay for them. Financial markets run on a two-party system—bulls and bears, with a huge silent majority of undecided traders who may throw their weight to either party. Technical analysis is a poll of market participants.
If bulls are on top, we should cover shorts and go long. If bears are stronger, we should go short. If an election is too close to call, a wise trader stands aside. Standing aside is a legitimate market position and the only one in which you can’t lose money. Individual behavior is difficult to predict. Crowds are much more primitive and their behavior more repetitive and predictable. Our job is not to argue with the crowd, telling it what’s rational or irrational. We need to identify crowd behavior and decide how likely it is to continue. If the trend is up and we find that the crowd is growing more optimistic, we should trade that market from the long side. When we find that the crowd is becoming less optimistic, it is time to sell. If the crowd seems confused, we should stand aside and wait for the market to make up its mind.
The Meaning of Prices
Highs and lows, opening and closing prices, intraday swings and weekly ranges reflect crowd behavior. Our charts, indicators, and technical tools are windows into the mass psychology of the markets. You have to be clear about what you are studying if you want to get closer to the truth. Many market participants have backgrounds in science and engineering and are often tempted to apply the principles of physics. For example, they may try to filter out the noise of a trading range to obtain a clear signal of a trend. Those methods can help, but they cannot be converted into automatic trading systems because the markets are not physical processes. They are reflections of crowd psychology, which follows different, less precise laws. In physics, if you calculate everything, you’ll predict where a process will take you. Not so in the markets, where a crowd can always throw you a curve. Here you have to act within this atmosphere of uncertainty, which is why you must protect yourself with good money management.
The Open The opening price, the first price of the day, is marked on a bar chart by a tick pointing to the left. An opening price reflects the influx of overnight orders. Who placed those orders? A dentist who read a tip in a magazine after dinner, a teacher whose broker touted a trade but who needed his wife’s permission to buy, a financial officer of a slow-moving institution who sat in a meeting all day waiting for his idea to be approved by a committee. They are the people who place orders before the open. Opening prices reflect opinions of less informed market participants.
When outsiders buy or sell, who takes the opposite side of their trades? Market professionals step in to help, only they do not run a charity. If floor traders see more buy orders coming in, they open the market higher, forcing outsiders to overpay. The pros go short, so that the slightest dip makes them money. If the crowd is fearful before the opening and sell orders predominate, the floor opens the market very low. They acquire their goods on the cheap, so that the slightest bounce earns them short-term profits. The opening price establishes the first balance of the day between outsiders and insiders, amateurs and professionals. If you are a short-term trader, pay attention to the opening range—the high and the low of the first 15 to 30 minutes of trading. Most opening ranges are followed by breakouts, which are important because they show who is taking control of the market. Several intraday trading systems are based on following opening range breakouts.
The High Why do prices go up? The standard answer—more buyers than sellers—makes no sense because for every trade there is a buyer and a seller. The market goes up when buyers have more money and are more enthusiastic than sellers. Buyers make money when prices go up. Each uptick adds to their profits. They feel flushed with success, keep buying, call friends and tell them to buy—this thing is going up!Eventually, prices rise to a level where bulls have no more money to spare and some start taking profits. Bears see the market as overpriced and hit it with sales. The market stalls, turns, and begins to fall, leaving behind the high point of the day. That point marks the greatest power of bulls for that day.
The high of every bar reflects the maximum power of bulls during that bar. It shows how high bulls could lift the market during that time period. The high of a daily bar reflects the maximum power of bulls during that day, the high of a weekly bar shows the maximum power of bulls during that week, and the high of a five-minute bar shows their maximum power in those five minutes.
The Low Bears make money when prices fall, with each downtick making money for short sellers. As prices slide, bulls become more and more skittish. They cut back their buying and step aside, figuring they’ll be able to pick up what they want cheaper at a later time. When buyers pull in their horns, it becomes easier for bears to push prices lower, and the decline continues.
It takes money to sell stocks short, and a fall in prices slows down when bears start running low on money. Bullish bargain hunters appear on the scene. Experienced traders recognize what’s happening and start covering shorts and going long. Prices rally from their lows, leaving behind the low mark—the lowest tick of the day. The low point of each bar reflects the maximum power of bears during that bar. The lowest point of a daily bar reflects the maximum power of bears during that day, the low point of a weekly bar shows the maximum power of bears during that week, and the low of a five-minute bar shows the maximum power of bears during those five minutes. Several years ago I designed an indicator, called Elder-ray, for tracking the relative power of bulls and bears by measuring how far the high and the low of each bar get away from the average price.
The Close The closing price is marked on a bar chart by a tick pointing to the right. It reflects the final consensus of value for the day. This is the price at which most people look in their daily newspapers. It is especially important in the futures markets, because the settlement of trading accounts depends on it. Professional traders monitor markets throughout the day. Early in the day they take advantage of opening prices, selling high openings and buying low openings, and then unwinding those positions. Their normal mode of operations is to fade—trade against—market extremes and for the return to normalcy. When prices reach a new high and stall, professionals sell, nudging the market down. When prices stabilize after a fall, they buy, helping the market rally. The waves of buying and selling by amateurs that hit the market at the opening usually subside as the day goes on. Outsiders have done what they planned to do, and near the closing time the market is dominated by professional traders.
Closing prices reflect the opinions of professionals. Look at any chart, and you’ll see how often the opening and closing ticks are at the opposite ends of a price bar. This is because amateurs and professionals tend to be on the opposite sides of trades. Candlesticks and Point and Figure Bar charts are most widely used for tracking prices, but there are other methods. Candlestick charts became popular in the West in the 1990s. Each candle represents a day of trading with a body and two wicks, one above and another below. The body reflects the spread between the opening and closing prices. The tip of the upper wick reaches the highest price of the day and the lower wick the lowest price of the day. Candlestick chartists believe that the relationship between the opening and closing prices is the most important piece of daily data. If prices close higher than they opened, the body of the candle is white, but if prices close lower, the body is black.
The height of a candle body and the length of its wicks reflect the battles between bulls and bears. Those patterns, as well as patterns for med by several neighboring candles, provide useful insights into the power struggle in the markets and can help us decide whether to go long or short. The trouble with candles is they are too fat. I can glance at a computer screen with a bar chart and see five to six months of daily data, without squeezing the scale. Put a candlestick chart in the same space, and you’ll be lucky to get two months of data on the screen. Ultimately, a candlestick chart doesn’t reveal anything more than a bar chart. If you draw a normal bar chart and pay attention to the relationships of opening and closing prices, augmenting that with several technical indicators, you’ll be able to read the markets just as well and perhaps better. Candlestick charts are useful for some but not all traders. If you like them, use them. If not, focus on your bar charts and don’t worry about missing something essential.
Point and figure (P&F) charts are based solely on prices, ignoring volume. They differ from bar and candlestick charts by having no horizontal time scale. When markets become inactive, P&F charts stop drawing because they add a new column of X’s and O’s only when prices change beyond a certain trigger point. P&F charts make congestion areas stand out, helping traders find support and resistance and providing targets for reversals and profit taking. P&F charts are much older than bar charts. Professionals in the pits sometimes scribble them on the backs of their trading decks.
Choosing a chart is a matter of personal choice. Pick the one that feels most comfortable. I prefer bar charts but know many serious traders who like P&F charts or candlestick charts.
The Reality of the Chart
Price ticks coalesce into bars, and bars into patterns, as the crowd writes its emotional diary on the screen. Successful traders learn to recognize a few patterns and trade them. They wait for a familiar pattern to emerge like fishermen wait for a nibble at a riverbank where they fished many times in the past. Many amateurs jump from one stock to another, but professionals tend to trade the same markets for years. They learn their intended catch’s personality, its habits and quirks. When professionals see a short-term bottom in a familiar stock, they recognize a bargain and buy. Their buying checks the decline and pushes the stock up. When prices rise, the pros reduce their buying, but amateurs rush in, sucked in by the good news. When markets become overvalued, professionals start unloading their inventory.
Their selling checks the rise and pushes the market down. Amateurs become spooked and start dumping their holdings, accelerating the decline. Once weak holders have been shaken out, prices slide to the level where professionals see a bottom, and the cycle repeats. That cycle is not mathematically perfect, which is why mechanical systems tend not to work. Using technical indicators requires judgment. Before we review specific chart patterns, let us agree on the basic definitions: An uptrend is a pattern in which most rallies reach a higher point than the preceding rally; most declines stop at a higher level than the preceding decline.
A downtrend is a pattern in which most declines fall to a lower point than the preceding decline; most rallies rise to a lower level than the preceding rally. An uptrendline is a line connecting two or more adjacent bottoms, slanting upwards; if we draw a line parallel to it across the tops, we’ll have a trading channel.
A downtrendline is a line connecting two or more adjacent tops, slanting down; one can draw a parallel line across the bottoms, marking a trading channel.
Support is marked by a horizontal line connecting two or more adjacent bottoms. One can often draw a parallel line across the tops, marking a trading range. sistance is marked by a horizontal line connecting two or more adjacent tops. One can often draw a parallel line below, across the bottoms, to mark a trading range. Tops and Bottoms The tops of rallies mark the areas of the maximum power of bulls. They would love to lift prices even higher and make more money, but that’s where they get overpowered by bears. The bottoms of declines, on the other hands, are the areas of maximum power of bears. They would love to push prices even lower and profit from short positions, but they get overpowered by bulls. Use a computer or a ruler to draw a line connecting nearby tops. If it slants up, it shows that bulls are becoming stronger which is a good thing to know if you plan to trade from the long side. If that line slants down, it shows that bulls are becoming weaker and buying is not such a good idea.
Trendlines applied to market bottoms help visualize changes in the power of bears. When a line connecting two nearby bottoms slants down, it shows that bears are growing stronger, and short selling is a good option. If that line slants up, however it shows that bear are becoming weaker. Uptrendlines and Downtrendlines Prices often appear to travel along invisible roads. When peaks rise higher at each successive rally, prices are in an uptrend. When bottoms keep falling lower and lower, prices are in a downtrend.
We can identify uptrends by drawing trendlines connecting the bottoms of declines. We use bottoms to identify an uptrend because the peaks of rallies tend to be expansive, uneven affairs during uptrends. The declines tend to be more orderly, and when you connect them with a trendline, you get a truer picture of that uptrend. We identify downtrends by drawing trendlines across the peaks of rallies. Each new low in a downtrend tends to be lower than the preceding low, but the panic among weak holders can make bottoms irregularly sharp. Drawing a downtrendline across the tops of rallies paints a more correct picture of that downtrend. The most important feature of a trendline is the direction of its slope.
When it rises, the bulls are in control, and when it declines, the bears are in charge. The longer the trendline and the more points of contact it has with prices, the more valid it is. The angle of a trendline reflects the emotional temperature of the crowd. Quiet, shallow trends can last a long time. As trends accelerate, trendlines have to be redrawn, making them steeper. When they rise or fall at 60° or more, their breaks tend to lead to major reversals. This sometimes happens near the tail ends of runaway moves.
You can plot these lines using a ruler or a computer. It is better to draw trendlines as well as support and resistance lines across the edges of congestion areas instead of price extremes. Congestion areas reflect crowd behavior, while the extreme points show only the panic among the weakest crowd members. Tails—The Kangaroo Pattern Trends take a long time to form, but tails are created in just a few days. They provide valuable insights into market psychology, mark reversal areas, and point to trading opportunities. A tail is a one-day spike in the direction of a trend, followed by a reversal. It takes a minimum of three bars to create a tail—relatively narrow bars in the beginning and at the end, with an extremely wide bar in the middle. That middle bar is the tail, but you won’t know for sure until the following day, when a bar has sharply narrowed back at the base, letting the tail hang out. A tail sticks out from a tight weave of prices—you can’t miss it.
A kangaroo, unlike a horse or a dog, propels itself by pushing with its tail. You can always tell which way a kangaroo is going to jump—opposite its tail. When the tail points north, the kangaroo jumps south, and when the tail points south, it jumps north. Market tails tend to occur at turning points in the markets, which recoil from them like kangaroos recoil from their tails. A tail does not forecast the extent of a move, but the first jump usually lasts a few days, offering a trading opportunity. You can do well by recognizing tails and trading against them. Before you trade any pattern, you must understand what it tells you about the market. Why do markets jump away from their tails? Exchanges are owned by members who profit from volume rather than trends. Markets fluctuate, looking for price levels that will bring the highest volume of orders. Members do not know where those levels are, but they keep probing higher and lower. A tail shows that the market has tested a certain price level and rejected it.
If a market stabs down and recoils, it shows that lower prices do not attract volume. The natural thing for the market to do next is rally and test higher levels to see whether higher prices will bring more volume. If the market stabs higher and recoils, leaving a tail pointing upward, it shows that higher prices do not attract volume. The members are likely to sell the market down in order to find whether lower prices will attract volume. Tails work because the owners of the market are looking to maximize income. Whenever you see a very tall bar (several times the average for recent months) shooting in the direction of the existing trend, be alert to the possibility of a tail. If the following day the market traces a very narrow bar at the base of the tall bar, it completes a tail. Be ready to put on a position, trading against that tail, before the close.
When a market hangs down a tail, go long in the vicinity of the base of that tail. Once long, place a protective stop approximately half-way down the tail. If the market starts chewing its tail, run without delay. The targets for profit taking on these long positions are best established by using moving averages and channels (see “Indicators—Five Bullets to a Clip,” page 84). When a market puts up a tail, go short in the area of the base of that tail. Once short, place a protective stop approximately half-way up the tail. If the market starts rallying up its tail, it is time to run; do not wait for the entire tail to be chewed up. Establish profit-taking targets using moving averages and channels. You can trade against tails in any timeframe. Daily charts are most common, but you can also trade them on intraday or weekly charts. The magnitude of a move depends on its timeframe. A tail on a weekly chart will generate a much bigger move than a tail on a five-minute chart.
Support, Resistance, and False Breakouts When most traders and investors buy and sell, they make an emotional as well as a financial commitment to their trade. Their emotions can propel market trends or send them into reversals.
The longer a market trades at a certain level, the more people buy and sell. Suppose a stock falls from 80 and trades near 70 for several weeks, until many believe that it has found support and reached its bottom. What happens if heavy selling comes in and shoves that stock down to 60? Smart longs will run fast, banging out at 69 or 68. Others will sit through the entire painful decline. If losers haven’t given up near 60 and are still alive when the market trades back towards 70, their pain will prompt them to jump at a chance to “get out even.” Their selling is likely to cap a rally, at least temporarily. Their painful memories are the reason why the areas that served as support on the way down become resistance on the way up, and vice versa.
Regret is another psychological force behind support and resistance. If a stock trades at 80 for a while and then rallies to 95, those who did not buy it near 80 feel as if they missed the train. If that stock sinks back near 80, traders who regret a missed opportunity will return to buy in force. Support and resistance can remain active for months or even years because investors have long memories. When prices return to their old levels, some jump at the opportunity to add to their positions while others see a chance to get out. Whenever you work with a chart, draw support and resistance lines across recent tops and bottoms. Expect a trend to slow down in those areas, and use them to enter positions or take profits. Keep in mind that support and resistance are flexible—they are like a ranch wire fence rather than a glass wall. A glass wall is rigid and shatters when broken, but a herd of bulls can push against a wire fence, shove their muzzles through it, and it will lean but stand. Markets have many false breakouts below support and above resistance, with prices returning into their range after a brief violation.
A false upside breakout occurs when the market rises above resistance and sucks in buyers before reversing and falling. A false downside breakout occurs when prices fall below support, attracting more bears just before a rally. False breakouts provide professionals with some of the best trading opportunities. They are similar to tails, only tails have a single wide bar, whereas false breakouts can have several bars, none of them especially tall. What causes false breakouts and how do you trade them? At the end of a long rise the market hits resistance, stops, and starts churning. The professionals know there are many more buy orders above the resistance level. Some were placed by traders looking to buy a new breakout, and others are protective stops placed by those who went short on the way up. The pros are the first to know where people have stops because they are the ones holding the orders.
A false breakout occurs when the pros organize a fishing expedition to run stops. For example, when a stock is slightly below its resistance at 60, the floor may start loading up on longs near 58.85. As sellers pull back, the market roars above 60, setting off buy stops. The floor starts selling into that rush, unloading longs as prices touch 60.50. When they see that public buy orders are drying up, they sell short and prices tank back below 60. That’s when your charts show a false breakout above 60. S&P 500 futures are notorious for false breakouts. Day after day this market exceeds its previous day’s high or falls below its previous day’s low by a few ticks (a tick is the minimum price change permitted by the exchange where an instrument is traded). This is one of the reasons the S&P is a difficult market to trade, but it attracts beginners like flies. The floor has a field day slapping them.
Some of the best trading opportunities occur after false breakouts. When prices fall back into the range after a false upside breakout, you have extra confidence to trade short. Use the top of the false breakout as your stoploss point. Once prices rally back into their range after a false downside breakout, you have extra confidence to trade long. Use the bottom of that false breakout for your stop-loss point. If you have an open position, defend yourself against false breakouts by reducing your trading size and placing wider stops. Be ready to reposition if stopped out of your trade. There are many advantages to risking just a small fraction of your account on any trade. It allows you to be more flexible with stops. When the volatility is high, consider protecting a long position by buying a put or a short position by buying a call. Finally, if you get stopped out on a false breakout, don’t be shy about getting back into a trade. Beginners tend to make a single stab at a position and stay out if they are stopped out. Professionals, on the other hand, will attempt several entries before nailing down the trade they want. Double Tops and Bottoms Bulls make money when the market rises. There are always a few who take profits on the way up, but new bulls come in and the rally continues. Every rally reaches a point where enough bulls look at it and say—this is very nice, and it may get even nicer, but I’d rather have cash. Rallies top out after enough wealthy bulls take their profits, while the money from new bulls is not enough to replace what was taken out.
When the market heads down from its peak, savvy bulls, the ones who’ve cashed out early, are the most relaxed group. Other bulls who are still long, especially if they came in late, feel trapped. Their profits are melting away and turning into losses. Should they hold or sell? If enough moneyed bulls decide the decline is being overdone, they’ll step in and buy. As the rally resumes, more bulls come in. Now prices approach the level of their old top, and that’s where you can expect sell orders to hit the market. Many traders who got caught in the previous decline swear to get out if the market gives them a second chance. As the market rises toward its previous peak, the main question is whether it will it rise to a new high or form a double top and turn down. Technical indicators can be of great help in answering this question. When they rise to a new high, they tell you to hold, and when they form bearish divergences, they tell you to take profits at the second top.
A mirror image of this situation occurs at market bottoms. The market falls to a new low at which enough smart bears start covering shorts and the market rallies. Once that rally peters out and prices start sinking again, all eyes are on the previous low—will it hold? If bears are strong and bulls skittish, prices will break below the first low, and the downtrend will continue. If bears are weak and bulls are strong, the decline will stop in the vicinity of the old low, creating a double bottom. Technical indicators help decipher which of the two is more likely to happen. Triangles A triangle is a congestion area, a pause when winners take profits and new trend followers get aboard, while their opponents trade against the preceding trend. It is like a train station. The train stops to let passengers off and pick up new ones, but there is always a chance this is the last stop on the line and it may turn back. The upper boundary of a triangle shows where sellers overpower buyers and prevent the market from rising. The lower boundary shows where buyers overpower sellers and prevent the market from falling. As the two start to converge, you know a breakout is coming. As a general rule, the trend that preceded the triangle deserves the benefit of the doubt. The angles between triangle walls reflect the balance of power between bulls and bears and hint at the likely direction of a breakout.
An ascending triangle has a flat upper boundary and a rising lower boundary. The flat upper line shows that bears have drawn a line in the sand and sell whenever the market comes to it. They must be a pretty powerful group, calmly waiting for prices to come to them before unloading. At the same time buyers are becoming more aggressive. They snap up merchandise and keep raising the floor under the market. On what party should you bet? Nobody knows who’ll win the election, but savvy traders tend to place buy orders slightly above the upper line of an ascending triangle. Since sellers are on the defensive, if the attacking bulls succeed, the breakout is likely to be steep. This is the logic of buying upside breakouts from ascending triangles.
A descending triangle has a flat lower boundary and a declining upper boundary. The horizontal lower line shows that bulls are pretty determined, calmly waiting to buy at a certain level. At the same time, sellers are becoming more aggressive. They keep selling at lower and lower levels, pushing the market closer to the line drawn by buyers. As a trader, which way will you bet—on the bulls or the bears? Experienced traders tend to place their orders to sell short slightly below the lower line of a descending triangle. Let buyers defend that line, but if bulls collapse after a long defense, a break is likely to be sharp. This is the logic of shorting downside breakouts from descending triangles. A symmetrical triangle shows that both bulls and bears are equally confident. Bulls keep paying up, and bears keep selling lower. Neither group is backing off, and their fight must be resolved before prices reach the tip of the triangle. The breakout is likely to go in the direction of the trend that preceded the triangle. Volume Each unit of volume represents the actions of two individuals—a buyer and a seller. It can be measured by several numbers: shares, contracts, or dollars that have changed hands. Volume is usually plotted as a histogram below prices. It provides important clues about the actions of bulls and bears. Rising volume tends to confirm trends, and falling volume brings them into question.
Volume reflects the level of pain among market participants. At each tick in every trade, one person is winning and the other losing. Markets can move only if enough new losers enter the game to supply profits to winners. If the market is falling, it takes a very courageous or reckless bull to step in and buy, but without him there is no increase in volume. When the trend is up, it takes a very brave or reckless bear to step in and sell. Rising volume shows that losers are continuing to come in, allowing the trend to continue. When losers start abandoning the market, volume falls, and the trend runs out of steam. Volume gives traders several useful clues. A one-day splash of uncommonly high volume often marks the beginning of a trend when it accompanies a breakout from a trading range. A similar splash tends to mark the end of a trend if it occurs during a wellestablished move. Exceedingly high volume, three or more times above average, identifies market hysteria. That is when nervous bulls finally decide that the uptrend is for real and rush in to buy or nervous bears become convinced that the decline has no bottom and jump in to sell short.
Markets emit huge volumes of information. Our tools help organize these flows into a manageable form. It is important to select analytic tools and techniques that make sense to you, put them together into a coherent system, and focus on money management. When we make our trading decisions at the right edge of the chart, we deal with probabilities, not certainties. If you want certainty, go to the middle of the chart and try to find a broker who will accept your orders.
This chapter on technical analysis shows how one trader goes about analyzing markets. Use it as a model for choosing your favorite tools, rather than following it slavishly. Test any method you like on your own data because only personal testing will convert information into knowledge and make these methods your own. Many concepts in this book are illustrated with charts. I selected them from a broad range of markets—stocks as well as futures. Technical analysis is a universal language, even though the accents differ. You can apply what you’ve learned from the chart of IBM to silver or Japanese yen. I trade mostly in the United States, but have used the same methods in Germany.
Russia, Singapore, and Australia. Knowing the language of technical analysis enables you to read any market in the world. Analysis is hard, but trading is much harder. Charts reflect what has happened. Indicators reveal the balance of power between bulls and bears. Analysis is not an end in itself, unless you get a job as an analyst for a company. Our job as traders is to make decisions to buy, sell, or stand aside on the basis of our analysis. After reviewing each chart, you need to go to its hard right edge and decide whether to bet on bulls, bet on bears, or stand aside. You must follow up chart analysis by establishing profit targets, setting stops, and applying money management rules.
BASIC CHARTING
A trade is a bet on a price change. You can make money buying low and selling high or shorting high and covering low. Prices are central to our enterprise, yet few traders stop to think what prices are. What exactly are we trying to analyze?
 |
| Technical Analysis |
Many traders have no clear idea what they are trying to analyze. Balance sheets of companies? Pronouncements of the Federal Reserve? Weather reports from soybean-growing states? The cosmic vibrations of Gann theory? Every chart serves as an ongoing poll of the market. Each tick represents a momentary consensus of value of all market participants. High and low prices, the height of every bar, the angle of every trendline, the duration of every pattern reflect aspects of crowd behavior. Recognizing these patterns can help us decide when to bet on bulls or bears. During an election campaign pollsters call thousands of people asking how they’ll vote. Well-designed polls have predictive value, which is why politicians pay for them. Financial markets run on a two-party system—bulls and bears, with a huge silent majority of undecided traders who may throw their weight to either party. Technical analysis is a poll of market participants.
If bulls are on top, we should cover shorts and go long. If bears are stronger, we should go short. If an election is too close to call, a wise trader stands aside. Standing aside is a legitimate market position and the only one in which you can’t lose money. Individual behavior is difficult to predict. Crowds are much more primitive and their behavior more repetitive and predictable. Our job is not to argue with the crowd, telling it what’s rational or irrational. We need to identify crowd behavior and decide how likely it is to continue. If the trend is up and we find that the crowd is growing more optimistic, we should trade that market from the long side. When we find that the crowd is becoming less optimistic, it is time to sell. If the crowd seems confused, we should stand aside and wait for the market to make up its mind.
The Meaning of Prices
Highs and lows, opening and closing prices, intraday swings and weekly ranges reflect crowd behavior. Our charts, indicators, and technical tools are windows into the mass psychology of the markets. You have to be clear about what you are studying if you want to get closer to the truth. Many market participants have backgrounds in science and engineering and are often tempted to apply the principles of physics. For example, they may try to filter out the noise of a trading range to obtain a clear signal of a trend. Those methods can help, but they cannot be converted into automatic trading systems because the markets are not physical processes. They are reflections of crowd psychology, which follows different, less precise laws. In physics, if you calculate everything, you’ll predict where a process will take you. Not so in the markets, where a crowd can always throw you a curve. Here you have to act within this atmosphere of uncertainty, which is why you must protect yourself with good money management.
The Open The opening price, the first price of the day, is marked on a bar chart by a tick pointing to the left. An opening price reflects the influx of overnight orders. Who placed those orders? A dentist who read a tip in a magazine after dinner, a teacher whose broker touted a trade but who needed his wife’s permission to buy, a financial officer of a slow-moving institution who sat in a meeting all day waiting for his idea to be approved by a committee. They are the people who place orders before the open. Opening prices reflect opinions of less informed market participants.
 |
| Trade Chart |
The High Why do prices go up? The standard answer—more buyers than sellers—makes no sense because for every trade there is a buyer and a seller. The market goes up when buyers have more money and are more enthusiastic than sellers. Buyers make money when prices go up. Each uptick adds to their profits. They feel flushed with success, keep buying, call friends and tell them to buy—this thing is going up!Eventually, prices rise to a level where bulls have no more money to spare and some start taking profits. Bears see the market as overpriced and hit it with sales. The market stalls, turns, and begins to fall, leaving behind the high point of the day. That point marks the greatest power of bulls for that day.
The high of every bar reflects the maximum power of bulls during that bar. It shows how high bulls could lift the market during that time period. The high of a daily bar reflects the maximum power of bulls during that day, the high of a weekly bar shows the maximum power of bulls during that week, and the high of a five-minute bar shows their maximum power in those five minutes.
The Low Bears make money when prices fall, with each downtick making money for short sellers. As prices slide, bulls become more and more skittish. They cut back their buying and step aside, figuring they’ll be able to pick up what they want cheaper at a later time. When buyers pull in their horns, it becomes easier for bears to push prices lower, and the decline continues.
It takes money to sell stocks short, and a fall in prices slows down when bears start running low on money. Bullish bargain hunters appear on the scene. Experienced traders recognize what’s happening and start covering shorts and going long. Prices rally from their lows, leaving behind the low mark—the lowest tick of the day. The low point of each bar reflects the maximum power of bears during that bar. The lowest point of a daily bar reflects the maximum power of bears during that day, the low point of a weekly bar shows the maximum power of bears during that week, and the low of a five-minute bar shows the maximum power of bears during those five minutes. Several years ago I designed an indicator, called Elder-ray, for tracking the relative power of bulls and bears by measuring how far the high and the low of each bar get away from the average price.
The Close The closing price is marked on a bar chart by a tick pointing to the right. It reflects the final consensus of value for the day. This is the price at which most people look in their daily newspapers. It is especially important in the futures markets, because the settlement of trading accounts depends on it. Professional traders monitor markets throughout the day. Early in the day they take advantage of opening prices, selling high openings and buying low openings, and then unwinding those positions. Their normal mode of operations is to fade—trade against—market extremes and for the return to normalcy. When prices reach a new high and stall, professionals sell, nudging the market down. When prices stabilize after a fall, they buy, helping the market rally. The waves of buying and selling by amateurs that hit the market at the opening usually subside as the day goes on. Outsiders have done what they planned to do, and near the closing time the market is dominated by professional traders.
Closing prices reflect the opinions of professionals. Look at any chart, and you’ll see how often the opening and closing ticks are at the opposite ends of a price bar. This is because amateurs and professionals tend to be on the opposite sides of trades. Candlesticks and Point and Figure Bar charts are most widely used for tracking prices, but there are other methods. Candlestick charts became popular in the West in the 1990s. Each candle represents a day of trading with a body and two wicks, one above and another below. The body reflects the spread between the opening and closing prices. The tip of the upper wick reaches the highest price of the day and the lower wick the lowest price of the day. Candlestick chartists believe that the relationship between the opening and closing prices is the most important piece of daily data. If prices close higher than they opened, the body of the candle is white, but if prices close lower, the body is black.
The height of a candle body and the length of its wicks reflect the battles between bulls and bears. Those patterns, as well as patterns for med by several neighboring candles, provide useful insights into the power struggle in the markets and can help us decide whether to go long or short. The trouble with candles is they are too fat. I can glance at a computer screen with a bar chart and see five to six months of daily data, without squeezing the scale. Put a candlestick chart in the same space, and you’ll be lucky to get two months of data on the screen. Ultimately, a candlestick chart doesn’t reveal anything more than a bar chart. If you draw a normal bar chart and pay attention to the relationships of opening and closing prices, augmenting that with several technical indicators, you’ll be able to read the markets just as well and perhaps better. Candlestick charts are useful for some but not all traders. If you like them, use them. If not, focus on your bar charts and don’t worry about missing something essential.
Point and figure (P&F) charts are based solely on prices, ignoring volume. They differ from bar and candlestick charts by having no horizontal time scale. When markets become inactive, P&F charts stop drawing because they add a new column of X’s and O’s only when prices change beyond a certain trigger point. P&F charts make congestion areas stand out, helping traders find support and resistance and providing targets for reversals and profit taking. P&F charts are much older than bar charts. Professionals in the pits sometimes scribble them on the backs of their trading decks.
Choosing a chart is a matter of personal choice. Pick the one that feels most comfortable. I prefer bar charts but know many serious traders who like P&F charts or candlestick charts.
The Reality of the Chart
Price ticks coalesce into bars, and bars into patterns, as the crowd writes its emotional diary on the screen. Successful traders learn to recognize a few patterns and trade them. They wait for a familiar pattern to emerge like fishermen wait for a nibble at a riverbank where they fished many times in the past. Many amateurs jump from one stock to another, but professionals tend to trade the same markets for years. They learn their intended catch’s personality, its habits and quirks. When professionals see a short-term bottom in a familiar stock, they recognize a bargain and buy. Their buying checks the decline and pushes the stock up. When prices rise, the pros reduce their buying, but amateurs rush in, sucked in by the good news. When markets become overvalued, professionals start unloading their inventory.
Their selling checks the rise and pushes the market down. Amateurs become spooked and start dumping their holdings, accelerating the decline. Once weak holders have been shaken out, prices slide to the level where professionals see a bottom, and the cycle repeats. That cycle is not mathematically perfect, which is why mechanical systems tend not to work. Using technical indicators requires judgment. Before we review specific chart patterns, let us agree on the basic definitions: An uptrend is a pattern in which most rallies reach a higher point than the preceding rally; most declines stop at a higher level than the preceding decline.
A downtrend is a pattern in which most declines fall to a lower point than the preceding decline; most rallies rise to a lower level than the preceding rally. An uptrendline is a line connecting two or more adjacent bottoms, slanting upwards; if we draw a line parallel to it across the tops, we’ll have a trading channel.
A downtrendline is a line connecting two or more adjacent tops, slanting down; one can draw a parallel line across the bottoms, marking a trading channel.
 |
| The Reality of The Chart |
Trendlines applied to market bottoms help visualize changes in the power of bears. When a line connecting two nearby bottoms slants down, it shows that bears are growing stronger, and short selling is a good option. If that line slants up, however it shows that bear are becoming weaker. Uptrendlines and Downtrendlines Prices often appear to travel along invisible roads. When peaks rise higher at each successive rally, prices are in an uptrend. When bottoms keep falling lower and lower, prices are in a downtrend.
We can identify uptrends by drawing trendlines connecting the bottoms of declines. We use bottoms to identify an uptrend because the peaks of rallies tend to be expansive, uneven affairs during uptrends. The declines tend to be more orderly, and when you connect them with a trendline, you get a truer picture of that uptrend. We identify downtrends by drawing trendlines across the peaks of rallies. Each new low in a downtrend tends to be lower than the preceding low, but the panic among weak holders can make bottoms irregularly sharp. Drawing a downtrendline across the tops of rallies paints a more correct picture of that downtrend. The most important feature of a trendline is the direction of its slope.
When it rises, the bulls are in control, and when it declines, the bears are in charge. The longer the trendline and the more points of contact it has with prices, the more valid it is. The angle of a trendline reflects the emotional temperature of the crowd. Quiet, shallow trends can last a long time. As trends accelerate, trendlines have to be redrawn, making them steeper. When they rise or fall at 60° or more, their breaks tend to lead to major reversals. This sometimes happens near the tail ends of runaway moves.
You can plot these lines using a ruler or a computer. It is better to draw trendlines as well as support and resistance lines across the edges of congestion areas instead of price extremes. Congestion areas reflect crowd behavior, while the extreme points show only the panic among the weakest crowd members. Tails—The Kangaroo Pattern Trends take a long time to form, but tails are created in just a few days. They provide valuable insights into market psychology, mark reversal areas, and point to trading opportunities. A tail is a one-day spike in the direction of a trend, followed by a reversal. It takes a minimum of three bars to create a tail—relatively narrow bars in the beginning and at the end, with an extremely wide bar in the middle. That middle bar is the tail, but you won’t know for sure until the following day, when a bar has sharply narrowed back at the base, letting the tail hang out. A tail sticks out from a tight weave of prices—you can’t miss it.
A kangaroo, unlike a horse or a dog, propels itself by pushing with its tail. You can always tell which way a kangaroo is going to jump—opposite its tail. When the tail points north, the kangaroo jumps south, and when the tail points south, it jumps north. Market tails tend to occur at turning points in the markets, which recoil from them like kangaroos recoil from their tails. A tail does not forecast the extent of a move, but the first jump usually lasts a few days, offering a trading opportunity. You can do well by recognizing tails and trading against them. Before you trade any pattern, you must understand what it tells you about the market. Why do markets jump away from their tails? Exchanges are owned by members who profit from volume rather than trends. Markets fluctuate, looking for price levels that will bring the highest volume of orders. Members do not know where those levels are, but they keep probing higher and lower. A tail shows that the market has tested a certain price level and rejected it.
If a market stabs down and recoils, it shows that lower prices do not attract volume. The natural thing for the market to do next is rally and test higher levels to see whether higher prices will bring more volume. If the market stabs higher and recoils, leaving a tail pointing upward, it shows that higher prices do not attract volume. The members are likely to sell the market down in order to find whether lower prices will attract volume. Tails work because the owners of the market are looking to maximize income. Whenever you see a very tall bar (several times the average for recent months) shooting in the direction of the existing trend, be alert to the possibility of a tail. If the following day the market traces a very narrow bar at the base of the tall bar, it completes a tail. Be ready to put on a position, trading against that tail, before the close.
When a market hangs down a tail, go long in the vicinity of the base of that tail. Once long, place a protective stop approximately half-way down the tail. If the market starts chewing its tail, run without delay. The targets for profit taking on these long positions are best established by using moving averages and channels (see “Indicators—Five Bullets to a Clip,” page 84). When a market puts up a tail, go short in the area of the base of that tail. Once short, place a protective stop approximately half-way up the tail. If the market starts rallying up its tail, it is time to run; do not wait for the entire tail to be chewed up. Establish profit-taking targets using moving averages and channels. You can trade against tails in any timeframe. Daily charts are most common, but you can also trade them on intraday or weekly charts. The magnitude of a move depends on its timeframe. A tail on a weekly chart will generate a much bigger move than a tail on a five-minute chart.
Support, Resistance, and False Breakouts When most traders and investors buy and sell, they make an emotional as well as a financial commitment to their trade. Their emotions can propel market trends or send them into reversals.
 |
| Trend |
Regret is another psychological force behind support and resistance. If a stock trades at 80 for a while and then rallies to 95, those who did not buy it near 80 feel as if they missed the train. If that stock sinks back near 80, traders who regret a missed opportunity will return to buy in force. Support and resistance can remain active for months or even years because investors have long memories. When prices return to their old levels, some jump at the opportunity to add to their positions while others see a chance to get out. Whenever you work with a chart, draw support and resistance lines across recent tops and bottoms. Expect a trend to slow down in those areas, and use them to enter positions or take profits. Keep in mind that support and resistance are flexible—they are like a ranch wire fence rather than a glass wall. A glass wall is rigid and shatters when broken, but a herd of bulls can push against a wire fence, shove their muzzles through it, and it will lean but stand. Markets have many false breakouts below support and above resistance, with prices returning into their range after a brief violation.
A false upside breakout occurs when the market rises above resistance and sucks in buyers before reversing and falling. A false downside breakout occurs when prices fall below support, attracting more bears just before a rally. False breakouts provide professionals with some of the best trading opportunities. They are similar to tails, only tails have a single wide bar, whereas false breakouts can have several bars, none of them especially tall. What causes false breakouts and how do you trade them? At the end of a long rise the market hits resistance, stops, and starts churning. The professionals know there are many more buy orders above the resistance level. Some were placed by traders looking to buy a new breakout, and others are protective stops placed by those who went short on the way up. The pros are the first to know where people have stops because they are the ones holding the orders.
A false breakout occurs when the pros organize a fishing expedition to run stops. For example, when a stock is slightly below its resistance at 60, the floor may start loading up on longs near 58.85. As sellers pull back, the market roars above 60, setting off buy stops. The floor starts selling into that rush, unloading longs as prices touch 60.50. When they see that public buy orders are drying up, they sell short and prices tank back below 60. That’s when your charts show a false breakout above 60. S&P 500 futures are notorious for false breakouts. Day after day this market exceeds its previous day’s high or falls below its previous day’s low by a few ticks (a tick is the minimum price change permitted by the exchange where an instrument is traded). This is one of the reasons the S&P is a difficult market to trade, but it attracts beginners like flies. The floor has a field day slapping them.
Some of the best trading opportunities occur after false breakouts. When prices fall back into the range after a false upside breakout, you have extra confidence to trade short. Use the top of the false breakout as your stoploss point. Once prices rally back into their range after a false downside breakout, you have extra confidence to trade long. Use the bottom of that false breakout for your stop-loss point. If you have an open position, defend yourself against false breakouts by reducing your trading size and placing wider stops. Be ready to reposition if stopped out of your trade. There are many advantages to risking just a small fraction of your account on any trade. It allows you to be more flexible with stops. When the volatility is high, consider protecting a long position by buying a put or a short position by buying a call. Finally, if you get stopped out on a false breakout, don’t be shy about getting back into a trade. Beginners tend to make a single stab at a position and stay out if they are stopped out. Professionals, on the other hand, will attempt several entries before nailing down the trade they want. Double Tops and Bottoms Bulls make money when the market rises. There are always a few who take profits on the way up, but new bulls come in and the rally continues. Every rally reaches a point where enough bulls look at it and say—this is very nice, and it may get even nicer, but I’d rather have cash. Rallies top out after enough wealthy bulls take their profits, while the money from new bulls is not enough to replace what was taken out.
When the market heads down from its peak, savvy bulls, the ones who’ve cashed out early, are the most relaxed group. Other bulls who are still long, especially if they came in late, feel trapped. Their profits are melting away and turning into losses. Should they hold or sell? If enough moneyed bulls decide the decline is being overdone, they’ll step in and buy. As the rally resumes, more bulls come in. Now prices approach the level of their old top, and that’s where you can expect sell orders to hit the market. Many traders who got caught in the previous decline swear to get out if the market gives them a second chance. As the market rises toward its previous peak, the main question is whether it will it rise to a new high or form a double top and turn down. Technical indicators can be of great help in answering this question. When they rise to a new high, they tell you to hold, and when they form bearish divergences, they tell you to take profits at the second top.
A mirror image of this situation occurs at market bottoms. The market falls to a new low at which enough smart bears start covering shorts and the market rallies. Once that rally peters out and prices start sinking again, all eyes are on the previous low—will it hold? If bears are strong and bulls skittish, prices will break below the first low, and the downtrend will continue. If bears are weak and bulls are strong, the decline will stop in the vicinity of the old low, creating a double bottom. Technical indicators help decipher which of the two is more likely to happen. Triangles A triangle is a congestion area, a pause when winners take profits and new trend followers get aboard, while their opponents trade against the preceding trend. It is like a train station. The train stops to let passengers off and pick up new ones, but there is always a chance this is the last stop on the line and it may turn back. The upper boundary of a triangle shows where sellers overpower buyers and prevent the market from rising. The lower boundary shows where buyers overpower sellers and prevent the market from falling. As the two start to converge, you know a breakout is coming. As a general rule, the trend that preceded the triangle deserves the benefit of the doubt. The angles between triangle walls reflect the balance of power between bulls and bears and hint at the likely direction of a breakout.
An ascending triangle has a flat upper boundary and a rising lower boundary. The flat upper line shows that bears have drawn a line in the sand and sell whenever the market comes to it. They must be a pretty powerful group, calmly waiting for prices to come to them before unloading. At the same time buyers are becoming more aggressive. They snap up merchandise and keep raising the floor under the market. On what party should you bet? Nobody knows who’ll win the election, but savvy traders tend to place buy orders slightly above the upper line of an ascending triangle. Since sellers are on the defensive, if the attacking bulls succeed, the breakout is likely to be steep. This is the logic of buying upside breakouts from ascending triangles.
A descending triangle has a flat lower boundary and a declining upper boundary. The horizontal lower line shows that bulls are pretty determined, calmly waiting to buy at a certain level. At the same time, sellers are becoming more aggressive. They keep selling at lower and lower levels, pushing the market closer to the line drawn by buyers. As a trader, which way will you bet—on the bulls or the bears? Experienced traders tend to place their orders to sell short slightly below the lower line of a descending triangle. Let buyers defend that line, but if bulls collapse after a long defense, a break is likely to be sharp. This is the logic of shorting downside breakouts from descending triangles. A symmetrical triangle shows that both bulls and bears are equally confident. Bulls keep paying up, and bears keep selling lower. Neither group is backing off, and their fight must be resolved before prices reach the tip of the triangle. The breakout is likely to go in the direction of the trend that preceded the triangle. Volume Each unit of volume represents the actions of two individuals—a buyer and a seller. It can be measured by several numbers: shares, contracts, or dollars that have changed hands. Volume is usually plotted as a histogram below prices. It provides important clues about the actions of bulls and bears. Rising volume tends to confirm trends, and falling volume brings them into question.
Volume reflects the level of pain among market participants. At each tick in every trade, one person is winning and the other losing. Markets can move only if enough new losers enter the game to supply profits to winners. If the market is falling, it takes a very courageous or reckless bull to step in and buy, but without him there is no increase in volume. When the trend is up, it takes a very brave or reckless bear to step in and sell. Rising volume shows that losers are continuing to come in, allowing the trend to continue. When losers start abandoning the market, volume falls, and the trend runs out of steam. Volume gives traders several useful clues. A one-day splash of uncommonly high volume often marks the beginning of a trend when it accompanies a breakout from a trading range. A similar splash tends to mark the end of a trend if it occurs during a wellestablished move. Exceedingly high volume, three or more times above average, identifies market hysteria. That is when nervous bulls finally decide that the uptrend is for real and rush in to buy or nervous bears become convinced that the decline has no bottom and jump in to sell short.
THE MATURE TRADER
 |
| The Mature Trader |
Successful traders are often unconventional people, and some are very eccentric. When they mix with others, they often break social rules. The markets are set up for the majority to lose money, and a small group of winners marches to a different drummer, in and out of the markets. Markets consist of huge crowds of people watching the same trading vehicles, mesmerized by upticks and downticks. Think of a crowd at a concert or in a movie theater. When the show begins, the crowd gets emotionally in gear and develops an amorphous but powerful mass mind, laughing or weeping together. A mass mind also emerges in the markets, only here it is more malignant. Instead of laughing or weeping, the crowd seeks each trader’s private psychological weakness and hits him in that spot.
Markets seduce greedy traders into buying positions that are too large for their accounts and then destroy them with a reaction they cannot afford to sit out. They shake fearful traders out of winning trades with brief countertrend spikes before embarking on runaway moves. Lazy traders are the favorite victims of the market, which keeps throwing new tricks at the unprepared. Whatever your psychological flaws and fears, whatever your inner demons, whatever your hidden weaknesses and obsessions, the market will seek them out, find them, and use them against you, like a skilled wrestler uses his opponent’s own weight to toss him to the ground. Successful traders have outgrown or overcome their inner demons.
Instead of being tossed by the markets, they maintain their own balance and scan for chinks in the crowd’s armor, so that they can toss the market for a change. They may appear eccentric, but when it comes to trading they are much healthier than the crowd. Being a trader is a journey of self-discovery. Trade long enough, and you will face all your psychological handicaps—anxiety, greed, fear, anger, and sloth. Remember, you’re not in the markets for psychotherapy; self-discovery is a byproduct, not the goal of trading. The primary goal of a successful trader is to accumulate equity. Healthy trading boils down to two questions you need to ask in every trade: “What is my profit target?” and “How will I protect my capital?” A good trader accepts full responsibility for the outcome of every trade. You cannot blame others for taking your money. You have to improve your trading plans and methods of money management. It will take time, and it will take discipline.
Discipline
A friend of mine used to have a dog-training business. Occasionally a prospective client would call her and say, “I want to train my dog to come when called, but I do not want to train it to sit or lie down.” And she’d answer, “Training a dog to come off-leash is one of the hardest things to teach; you must do a lot of obedience training first. What you’re saying sounds like, ‘I want my dog be a neurosurgeon, but I do not want it to go to high school.’” Many new traders expect to sit in front of their screens and make easy money day-trading. They skip high school and head straight for neurosurgery.
 |
| Discipline |
As a matter of fact, other market participants want you to be undisciplined and impulsive. That makes it easier for them to get your money. Your defense against self-destructiveness is discipline. You have to set up your own rules and follow them in order to prevent self-sabotage. Discipline means designing, testing, and following your trading system. It means learning to enter and exit in response to predefined signals rather than jumping in and out on a whim. It means doing the right thing, not the easy thing. And the first challenge on the road to disciplined trading involves setting up a record-keeping system.
Record-Keeping
 |
| Record-Keeping |
If money is a problem, keeping and reviewing records of all expenditures is certain to uncover wasteful tendencies. Keeping scrupulous records turns a spotlight on a problem and allows you to improve. Becoming a good trader means taking several courses—psychology, technical analysis, and money management. Each course requires its own set of records. You’ll have to score high on all three in order to graduate.
Your first essential record is a spreadsheet of all your trades. You have to keep track of entries and exits, slippage and commissions, as well as profits and losses. Chapter 5, “Method—Technical Analysis” on trading channels will teach you to rate the quality of every trade, allowing you to compare performance across different markets and conditions. Another essential record shows the balance in your account at the end of each month. Plot it on a chart, creating an equity curve whose angle will tell you whether you are in gear with the market. The goal is a steady uptrend, punctuated by shallow declines. If your curve slopes down, it shows you’re not in tune with the markets and must reduce the size of your trades. A jagged equity curve tends to be a sign of impulsive trading.
Your trading diary is the third essential record. Whenever you enter a trade, print out the charts that prompted you to buy or sell. Paste them on the left page of a large notebook and write a few words explaining why you bought or sold, stating your profit objective and a stop. When you close out that trade, print out the charts again, paste them on the right page and write what you’ve learned from the completed trade.
These records are essential for all traders, and we will return to them later in Chapter 8, “The Organized Trader.” A shoebox crammed with confirmation slips does not qualify as a record-keeping system. Too many records? Not enough time? Want to skip high school and dive into neurosurgery? Traders fail because of impatience and lack of discipline. Good records set you apart from the market crowd and put you on the road to success.
Training for Battle
How much training you need depends on the job you want. If you want to be a janitor, an hour of training might do. Just learn to attach a mop to the right end of the broomstick and find a pail without holes. If, on the other hand, you want to fly an airplane or do surgery, you’ll have to learn a great deal more. Trading is closer to flying a plane than to mopping a floor, meaning you’ll need to invest a lot of time and energy in mastering this craft. Society mandates extensive training for pilots and doctors because their errors are so deadly. As a trader, you are free to be financially deadly to yourself—society does not care, because your loss is someone else’s gain. Flying and medicine have standards and yardsticks, as well as professional bodies to enforce them. In trading, you have to set up your own rules and be your own enforcer.
 |
| Training For Battle |
1. The Gradual Assumption of Responsibility A flying school doesn’t put a beginner into a pilot’s seat on his first day. A medical student is lucky if he is allowed to take a patient’s temperature on his first day in the hospital. His superiors double-check him before he can advance to the next, slightly higher level of responsibility. How does this compare to the education of a new trader? There is nothing gradual about it. Most people start out on an impulse, after hearing a hot tip or a rumor of someone making money. A beginner has some cash burning a hole in his pocket. He gets a broker’s name out of a newspaper, FedExes him a check, and enters his first trade. Now he is starting to learn!When do they close this market? What is a gap opening? How come the market is up and my stock is down?
A “sink or swim” approach does not work in complex enterprises, such as flying or trading. It is exciting to jump in, but excitement is not what good traders are after. If you do not have a specific trading plan, you’re better off taking your money to Vegas. The outcome will be the same, but at least there they’ll throw in some free drinks.
If you are serious about learning to trade, start with a relatively small account and set a goal of learning to rade rather than making a lot of money in a hurry. Keep a trading diary and put a performance grade on every trade.
2. Constant Evaluations and Ratings The progress of a flying cadet or a medical student is measured by hundreds of tests. Teachers constantly rate knowledge, skills, and decision-making ability. A student with good results is given more responsibility, but if his performance slips, he has to study more and take more tests. Do traders go through a similar process? As long as you have money in your account, you can make impulsive trades, trying to weasel your way out of a hole. You can throw confirmation slips into a shoebox, and give them to your accountant at tax time. No one can force you to look at your test results, unless you do it yourself.
The market tests us all the time, but only a few pay attention. It gives a performance grade to every trade and posts those ratings, but few people know where to look them up. Another highly objective test is our equity curve. If you trade several markets, you can take this test in every one of them, as well as in your account as a whole. Do most of us take this test? No. Pilots and doctors must answer to their licensing bodies, but traders sneak out of class because no one takes attendance and their internal discipline is weak. Meanwhile, tests are a key part of trading discipline, essential for your victory in the markets. Keeping and reviewing records, as outlined later in this book, puts you a mile ahead of undisciplined competitors.
3. Training until Actions Become Automatic During one of my finals in medical school I was sent to examine a patient in a half-empty room. Suddenly I heard a noise from behind the curtain. I looked, and there was another patient—dying. “No pulse,” I yelled to another student, and together we put the man on the floor. I began pumping his chest, while the other fellow gave him mouth to mouth, one forced breath for four chest pumps. Neither of us could run for help, but someone opened the door and saw us. A reanimation team raced in, zapped the man with a defibrillator and pulled him out.
I never had to revive anyone before, but it worked the first time because I had five years of training. When the time came to act, I didn’t have to think. The point of training is to make actions automatic, allowing us to concentrate on strategy. What will you do if your stock jumps five points in your favor? Five points against you? What if your future goes limit up? Limit down? If you have to stop and think while you’re in a trade, you’re dead. You need to spend time preparing trading plans and deciding in advance what you will do when the market does any imaginable thing. Play those scenarios in your head, use your computer, and get yourself to the point where you do not have to ruminate about what to do if the market jumps.
The mature trader arrives at a stage where most trading actions have become nearly automatic. This gives you the freedom to think about strategy. You think about what you want to achieve, and less about tactics of how to achieve it. To reach that point, you need to trade for a long time. The longer you trade and the more trades you put on, the more you’ll learn. Trade a small size while learning and put on many trades. Remember, the first item on the agenda for a beginner is to learn how to trade, not to make money. Once you’ve learned to trade, money will follow.
Thursday, December 27, 2012
A REMEDY FOR SELF-DESTRUCTIVENESS
 |
| Bad Luck |
People who like to complain about their bad luck are often experts in looking for trouble and snatching defeat from the jaws of victory. A friend in the construction business used to have a driver who dreamed of buying his own truck and working for himself. He saved money for years and finally paid cash for a huge brand-new truck. He quit his job, got gloriously drunk, and at the end of the day rolled his uninsured truck down an embankment—it was totaled, and the driver came back asking for his old job. Tragedy? Drama? Or fear of freedom and an unconscious wish for a safe job with a steady paycheck? Why do intelligent people with a track record of success keep losing money on one harebrained trade after another, stumbling from calamity to catastrophe? Ignorance? Bad luck? Or a hidden desire to fail? Many people have a self-destructive streak. My experience as a psychiatrist has convinced me that most people who complain about severe problems are in fact sabotaging themselves. I cannot change a patient’s external reality, but whenever I cure one of self-sabotage, he quickly resolves his external problems.
Self-destructiveness is such a pervasive human trait because civilization is built on controlling aggression. As we grow up, we are trained to control aggression against others—behave, do not push, be nice. Our aggression has to go somewhere, and many turn it against themselves, the only unprotected target. We turn our anger inward and learn to sabotage ourselves. Little wonder so many of us grow up fearful, inhibited, and shy.
Society has several defenses against the extremes of self-sabotage. The police will talk a potential suicide down from the roof, and the medical board will take the scalpel away from an accident-prone surgeon, but no one will stop a self-defeating trader. He can run amok in the financial markets, inflicting wounds on himself, while brokers and other traders gladly take his money. Financial markets lack protective controls against self-sabotage. Are you sabotaging yourself? The only way to find out is to keep good records, especially a Trader’s Journal and an equity curve, shown later in this book. The angle of your equity curve is an objective indicator of your behavior. If it slopes up, with few downticks, you’re doing well. If it points down, it shows you’re not in gear with the markets and possibly in a self-sabotage mode. When you observe that, reduce the size of your trades and spend more time with your Trader’s Journal figuring out what you’re doing.
You need to become a self-aware trader. Keep good records, learn from past mistakes, and do better in the future. Traders who lose money tend to feel ashamed. A bad loss feels like a nasty comment—most people just want to cover up, walk away, and never be seen again. Hiding doesn’t solve anything. Use the pain of a loss to turn yourself into a disciplined winner.
Losers Anonymous
Years ago I had an insight that changed my trading life forever. Back in those days my equity used to swing up and down like a yo-yo. I knew enough about markets to profit from many trades but couldn’t hold on to my gains and grow equity. The insight that eventually got me off the roller coaster came from a chance visit to a meeting of Alcoholics Anonymous. One late afternoon I accompanied a friend to an AA meeting at a local YMCA. Suddenly, the meeting gripped me. I felt as if the people in the room were talking about my trading!All I had to do was substitute the word loss for the word alcohol. People at the AA meeting talked about how alcohol controlled their lives, and my trading in those days was driven by losses—fearing them and trying to trade my way out. My emotions followed a jagged equity curve—elation at the highs and cold clammy fear at the lows, with fingers trembling above the speed dial button.
Back in those days I had a busy psychiatric practice and saw my share of alcoholics. I began to notice similarities between them and losing traders. Losers approached markets the way alcoholics walked into bars. They entered with pleasant expectations, but left with mean headaches, hangovers, and loss of control. Drinking and trading lure people across the line from pleasure to self-destructiveness. Alcoholics and losers live with their eyes closed—both are in the grip of an addiction. Every alcoholic I saw in my office wanted to argue about his diagnosis. To avoid wasting time, I used to suggest a simple test. I’d tell alcoholics to keep on drinking as usual for the next week, but write down every drink, and bring that record to our next appointment.
 |
| Losers vs Winners |
Alcoholics and losers do not think about the past or the future, and focus only on the present—the sensation of alcohol pouring down the gullet or the market pulsing on the screen. An active alcoholic is in denial; he doesn’t want to know about the depth of his abyss, the severity of his problem, or the harm he is causing himself and others. The only thing that can pierce an alcoholic’s denial is the pain of hitting what AA calls “rock bottom.” It is each individual’s private version of hell—a life-threatening illness, a rejection by family, a job loss, or another catastrophic event. The unbearable pain of hitting rock bottom punctures the alcoholic’s denial and forces him to face a stark choice: he can self-destruct or turn his life around.
AA is a nonprofit voluntary organization whose only purpose is to help alcoholics stay sober. It doesn’t ask for donations, advertise, lobby, or take part in any public actions. It has no paid therapists; members help each other at meetings led by long-term members. AA has a system of sponsorships whereby older members sponsor and support newer ones. An alcoholic who joins AA goes through what is called a 12-Step program. Each step is a stage of personal growth and recovery. The method is so effective that people recovering from other addictive behaviors have begun to use it. The first step is the most important for traders. It looks easy, but is extremely hard to take. Many alcoholics can’t take it, drop out of AA, and go on to destroy their lives. The first step consists of standing up at a meeting, facing a room full of recovering alcoholics, and admitting that alcohol is stronger than you. This is hard because if alcohol is stronger than you, you cannot touch it again. Once you take the first step, you are committed to a struggle for sobriety.
Alcohol is such a powerful drug that AA recommends planning to live without it one day at a time. A recovering alcoholic does not plan to be sober a year or five years from now. He has a simpler goal—go to bed sober tonight. Eventually those days of sobriety add up to years. The entire system of AA meetings and sponsorships is geared toward the goal of sobriety one day at a time. AA aims to change not only the behavior but the personality in order
to reinforce sobriety. AA members call some people “sober drunks.” It sounds like a contradiction in terms. If a person is sober, how can he be a drunk? Sobriety alone is not enough. A person who has not changed his thinking is just one step away from sliding back into drinking under stress or out of boredom. An alcoholic has to change his way of being and feeling to recover from alcoholism.
I never had a problem with alcohol, but my psychiatric experience had taught me to respect AA for its success with alcoholics. It was not a popular view. Each patient who went to AA reduced the profession’s income, but that never bothered me. After my first AA meeting I realized that if millions of alcoholics could recover by following the program, then traders could stop losing, regain balance, and become winners by applying the principles of AA.
How can we translate the lessons of AA into the language of trading? A losing trader is in denial. His equity is shrinking, but he continues to jump into trades without analyzing what is going wrong. He keeps switching between markets the way an alcoholic switches between whiskey and cheap wine. An amateur whose mind isn’t strong enough to accept a small loss will eventually take the mother of all losses. A gaping hole in a trading account hurts self-esteem. A single huge loss or a series of bad losses smash a trader against his rock bottom. Most beginners collapse and wash out. The lifetime of an average speculator is measured in months, not years.
Those who survive fall into two groups. Some return to their old ways, just like alcoholics crawl into a bar after surviving a bout of delirium. They toss more money into their accounts and become customers of vendors who sell magical trading systems. They continue to gamble, only now their hands shake from anxiety and fear when they try to pull the trigger.
A minority of traders that hit rock bottom decide to change. Recovery is a slow and solitary process. Charles Mackay, the author of one of the best books on crowd psychology, wrote almost two centuries ago that men go mad in crowds, but come to their senses slowly, and one by one. I wish we had an organization for recovering traders, the way recovering alcoholics have AA. We don’t because trading is so competitive. Members of AA strive for sobriety together, but a meeting of recovering traders could easily be poisoned by envy and showing off. Markets are such cutthroat places that we don’t form mutual support groups or find sponsors. Some opportunists hold themselves out as traders’ coaches, but most make me shudder at their sharkiness. If we had a traders’ organization, I’d call it Losers Anonymous (LA). The name is blunt, but that’s fine. After all, Alcoholics Anonymous does not call itself Drinkers Anonymous. A harsh name helps traders face their impulsivity and selfsabotage.
Businessman’s Risk vs. Loss
 |
| Risk vs Loos |
We must draw a clear line between a loss and a businessman’s risk. A businessman’s risk is a small dip in equity. A loss goes through that limit. As a trader, I am in the business of trading and must take normal business risks, but I cannot afford losses. Imagine you’re not trading but running a fruit and vegetable stand. You take a risk each time you buy a crate of tomatoes. If your customers do not buy them, that crate will rot on you. That’s a normal business risk—you expect to sell most of your inventory, but some fruit and vegetables will spoil. As long as you buy carefully, keeping the unsold spoiled fruit to a small percentage of your daily volume, your business stays profitable.
 |
| Risk vs Loos |
Some traders have argued that my AA approach is too negative. A young woman in Singapore told me she believed in positive thinking and thought of herself as a winner. She could afford to be positive because discipline was imposed on her from the outside, by the manager of the bank for which she traded. Another winner who argued with me was a lady from Texas in her seventies, a wildly successful trader of stock index futures. She was very religious and viewed herself as a steward of money. Each morning she got up early and prayed long and hard. Then she drove to the office and traded the living daylights out of the S&P. The minute a trade went against her, she’d cut and run—because the money belonged to the Lord and wasn’t hers to lose. She kept her losses small and accumulated profits. I thought that our approaches had a lot in common. Both of us had principles outside the market preventing us from losing money. Markets are the most permissive places in the world. You may do any-thing you like, as long as you have enough equity to put on a trade.
It’s easy to get caught in the excitement, which is why you need rules. I rely on the principles of AA, another trader relies on her religious feelings, and you may choose something else. Just make sure you have a set of principles that clearly tells you what you may or may not do in the markets.
Sober in Battle
Most traders open accounts with money earned in business or the professions. Many bring a personal track record of success and expect to do well in the markets. If we can run a hotel, perform eye surgery, or try cases in court, we can surely find our way between the high, the low, and the close!But the markets, which seem so simple at first, keep humbling us.
 |
| Sober In Battle |
MIND—THE DISCIPLINED TRADER
 |
| Disciplined |
Most amateurs come to the markets with half-baked trading plans, clueless about psychology or money management. Most get hurt and quit after a few painful hits. Others find more cash and return to trading. We do not have to call people who keep dropping money in the markets losers because they do get something in return. What they get is fantastic entertainment value. Markets are the most entertaining places on the face of the Earth. They are like a card game, a chess game, and a horse race all rolled into one. The game goes on at all hours—you can always find action. An acquaintance of mine had a terrible home life. He avoided his wife by staying late in the office, but the building closed on weekends, pushing him into the bosom of his family. By Sunday mornings he could take no more “family togetherness” and escaped to the basement of his house. There he had set up a trading apparatus, using the equipment loaned to him by another loser in exchange for a share of future profits. What can you trade on a Sunday morning in suburban Boston? It turned out that the gold markets were open in the Middle East. My acquaintance used to turn on his quote screen, get on the phone (this was in the pre-Internet days), and trade gold in Abu Dhabi!
He never asked himself what his edge was over local traders. What has he got, sitting in a bucolic suburb of Boston, that they haven’t got in Abu Dhabi? Why should locals send him money? Every professional knows his edge, but ask an amateur and he’ll draw a blank. A person who doesn’t know his edge does not have it and will lose money. Warren Buffett, one of the richest investors on Earth, says that when you sit down to a game of poker, you must know within 15 minutes who is going to supply the winnings, and if you don’t know the answer, that person is you. My Boston buddy wound up losing his house in a bankruptcy, which put a whole new spin on his marital problems, even though he no longer traded gold in Abu Dhabi.
Many people, whether rich or poor, feel trapped and bored. As Henry David Thoreau wrote almost two centuries ago, “The mass of men lead lives of quiet desperation.” We wake up in the same bed each morning, eat the same breakfast, and drive to work down the same road. We see the same dull faces in the office and shuffle papers on our old desks. We drive home, watch the same dumb shows on TV, have a beer, and go to sleep in the same bed. We repeat this routine day after day, month after month, year after year. It feels like a life sentence without parole. What is there to look forward to? Perhaps a brief vacation next year? We’ll buy a package deal, fly to Paris, get on a bus with the rest of the group, and spend 15 minutes in front of the Triumphal Arch and half an hour going up the Eiffel Tower. Then back home, back to the old routine. Most people live in a deep invisible groove—no need to think, make decisions, feel the raw edge of life. The routine does feel comfortable—but deathly boring.
Even amusements stop being fun. How many Hollywood movies can you watch on a weekend until they all become a blur? How many trips to Disneyland can you take before all the rides in plastic soap dishes feel like one endless ride to nowhere? To quote Thoreau again, “A stereotyped but unconscious despair is concealed even under what are called games and amusements of mankind. There is no play in them.” And then you open a trading account and punch in an order to buy 500 shares of Intel. Anyone with a few thousand dollars can escape the routine and find excitement in the markets. Suddenly, the world is in living color!Intel ticks up half a point—you check quotes, run out for a newspaper, and tune in for the latest updates. If you have a computer at work, you set up a little quote window to keep an eye on your stock. Before the Internet, people used to buy pocket FM receivers for market quotes and hide them in halfopen desk drawers. Their antennae, sticking out of desks of middleaged men, looked like beams of light shining into prison cells.
Intel is up a point! Should you sell and take profits? Buy more and double up? Your heart is pounding—you feel alive!Now it’s up three points. You multiply that by the number of shares you have and realize that your profits after just a few hours are close to your weekly salary. You start calculating percentage returns—if you continue trading like that for the rest of the year, what a fortune you’ll have by Christmas!
Suddenly you raise your eyes from the calculator to see that Intel has dropped two points. Your stomach is tied in a knot, your face pushes into the screen, you hunch over, compressing your lungs, reducing the flow of blood to the brain, which is a terrible position for making decisions. You are flooded with anxiety, like a trapped animal. You are hurting—but you are alive! Trading is the most exciting activity that a person can do with their clothes on. Trouble is, you cannot feel excited and make money at the same time. Think of a casino, where amateurs celebrate over free drinks, while professional card-counters coldly play game after game, folding most of the time, and pressing their advantage when the card count gives them a slight edge over the house. To be a successful trader, you have to develop iron discipline (Mind), acquire an edge over the markets (Method), and control risks in your trading account (Money).
SLEEPWALKING THROUGH THE MARKETS
 |
| Markets |
Many intelligent people sleepwalk through the markets. Their eyes are open, but their minds are shut. They are driven by emotions and keep repeating their mistakes. It is OK to make mistakes but not OK to repeat them. When you wake a mistake for the first time, it shows that you are alive, searching, experimenting. Repeating a mistake is a neurotic symptom.
Losers come in all genders, ages, and colors, but several stock phrases give them away. Let us review some of the common excuses. If you recognize yourself, use that as a sign to start learning a new approach to the markets.
Blame the Broker
 |
| Blame The Broker |
A lawyer who was shopping for an expert witness recently called me. His client, a university professor, had shorted Dell at 20 several years ago, before the splits, after his broker told him it “could not go any higher.” That stock became the darling of the bull market, went through the roof, and a year later the professor covered at 80, wiping out his million-dollar account, which represented his life savings. That man was smart enough to earn a Ph.D. and save a million dollars but emotional enough to follow his broker while his life savings were doing a slow burn. Few people sue their brokers, but almost all beginners blame them. Traders’ feelings towards brokers are similar to patients’ feelings towards psychoanalysts. A patient lies on the couch, and the analyst’s voice, emerging at important moments, seems to carry deeper psychological truths than the patient could have possibly discovered himself.
In reality, a good broker is a craftsman who can sometimes help you get better fills and dig up information you requested. He is your helper—not your advisor. Looking to a broker for guidance is a sign of insecurity, which is not conducive to trading success. Most people start trading more actively after switching to electronic brokers. Low commissions are a factor, but the psychological change is more important. People are less self-conscious when they don’t have to deal with a live person. All of us occasionally make stupid trades, and electronic brokers allow us to make them in private. We are less ashamed hitting a key than calling a broker. Some traders manage to transfer their anxieties and fears onto electronic brokers. They complain that electronic brokers do not do what they want, such as accept certain types of orders. Why don’t you transfer your account, I ask—and see fear in their faces. It is the fear of change, of upsetting the cart. To be a successful trader, you must accept total responsibility for your decisions and actions.
Blame the Guru
 |
| Blame The Guru |
Some losing traders go looking for a trainer, a teacher, or a therapist. Very few people are experts in both psychology and trading. I’ve met several gurus who couldn’t trade their way out of a paper bag but claimed that their alleged expertise in psychology qualified them to train traders. Stop for a moment and compare this to sex therapy. If I had a sexual problem, I might see a psychiatrist, a psychologist, a sex therapist, or even a pastoral counselor, but I would never go to a Catholic priest, even if I were Catholic. That priest has no practical knowledge of the problem—and if he does, you want to run, not walk away. A teacher who does not trade is highly suspect. Traders go through several stages in their attitudes towards tips.
Beginners love them, those who are more serious insist on doing their own homework, while advanced traders may listen to tips but always drop them into their own trading systems to see whether that advice will hold up. Whenever I hear a trading tip, I run it through my own computerized screens. The decision to buy, go short, or stand aside is mine alone, with an average yield of one tip accepted out of every 20 heard. Tips draw my attention to opportunities I might have overlooked, but there are no shortcuts to sweating your own trades. A greenhorn who has gotten burned may ask for a guru’s track record. Years ago I used to publish a newsletter and noticed how frighteningly easy it was for gurus to massage and slant their records, even if they were tracked by independent rating services. I’ve never met a trader who took all the recommendations of his guru, even if he paid him a lot of money. If a guru has 200 subscribers, they’ll choose different recommendations, trade them differently, and most will lose money, each in his own way. There is a rule in the advisory business: “If you make forecasts for a living, make a lot of them.” Gurus offer convenient excuses to sleepwalking traders who need a scapegoat for their losses. Whether or not you listen to a guru, you’re 100% responsible for the outcome of your trades. The next time you get a hot tip, drop it into your trading system to see whether it gives you a buy or sell signal. You are responsible for the consequences of taking or rejecting advice.
Blame the Unexpected News
 |
| Unexpected News |
Most company news is released on a regular schedule. If you trade a certain stock, you should know well in advance when that company releases its earnings and be prepared for any market reaction to the news. Lighten up on your position if unsure about the impact of a coming announcement. If you trade bonds, currencies, or stock index futures, you must know when the key economic statistics are released and how the leading indicators or the unemployment rate can impact your market. It may be wise to tighten your stops or reduce the size of your trade in advance of an important news release. What about a truly unexpected piece of news—a president gets shot, a noted analyst comes out with a bearish earnings forecast, and so on? You must research your market and know what happened after similar events in the past; you have to do your homework before the event hits you. Having this knowledge allows you to act without delay. For example, the stock market’s reaction to an assault on a president has always been a sharp hiccup to the downside, followed by a complete retracement, so a sensible thing to do is buy the break. Your trading plan must include the possibility of a sharp adverse move caused by sudden events. You must have your stop in place, and the size of your trade must be such that you cannot get financially hurt in the case of a reversal. There are many risks waiting to spring on a trader—you alone are responsible for damage control.
Wishful Thinking
When the pain grows bit by bit, the natural tendency is to do nothing and wait for an improvement. A sleepwalking trader gives his losing trades “more time to work out,” while they slowly destroy his account. A sleepwalker hopes and dreams. He sits on a loss and says, “This stock is coming back; it always did.” Winners accept occasional losses, take them, and move on. Losers postpone taking losses. An amateur puts on a trade the way a kid buys a lottery ticket. He waits for the wheel of fortune to decide whether he wins or loses. Professionals, to the contrary, have ironclad plans for getting out, either with a profit or a small loss. One of the key differences between professionals and amateurs is their planning for exits. A sleepwalking trader buys at 35 and puts in a stop at 32. The stock sinks to 33, and he says, “I’ll give it a little more room.” He moves his stop down to 30. That is a fatal mistake—he has breached his discipline and violated his own plan.
 |
| Brain Thinking |
Once you’re in a trade, you begin to form an attachment to it. The market hypnotizes you and lures you into emotional decisions. This is why you must write down your exit plan and follow it. Turning a losing trade into an “investment” is a common disease among small private traders, but some institutional traders also suffer from it. Disasters at banks and major financial firms occur when poorly supervised traders lose money in short-term trades and stick them into long-term accounts, hoping that time will bail them out. If you are losing in the beginning, you’ll lose in the end. Do not put off the hour of reckoning. The first loss is the best loss—this is the rule of those of us who trade with our eyes open.
Wednesday, December 26, 2012
THE THREE M’S OF SUCCESSFUL TRADING
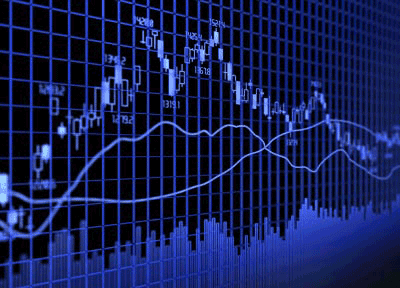
He may notice a new trend with rising momentum, indicating higher prices ahead. Or he may detect the feebleness of momentum during a rally, indicating weakness. Once he recognizes a pattern, he puts on a trade. He has a clear notion of how he’ll get in, where he’ll take profits, and where he’ll accept a loss if the market turns against him. A trade is a bet on a price change, but there is a paradox. Each price reflects the latest consensus of value of market participants. Putting on a trade challenges that consensus. A buyer disagrees with the collective wisdom by saying the market is underpriced. A seller disagrees with the wisdom of the entire group, believing the market is overpriced. Both the buyer and the seller expect the consensus to change, but meanwhile they defy the market. That market includes some of the most brilliant minds and some of the deepest pockets on Earth. Arguing with this group is dangerous business, and it has to be done very cautiously.
An intelligent trader looks for holes in the efficient market theory. He scans the market for brief periods of inefficiency. When the crowd is gripped by greed, the newcomers jump in and load up on stocks. When falling prices squeeze the fingers of thousands of buyers, they dump their holdings in a panic, disregarding fundamental values. Those episodes of emotional behavior dilute the cold efficiency of the market, creating opportunities for disciplined traders. When markets are calm and efficient, trading becomes a crapshoot, with commissions and slippage worsening the odds. Crowd mentality changes slowly, and price patterns recur, albeit with variations. Emotional swings provide trading opportunities, while efficient markets chop up and down, offering no edge to traders, only piling up their costs. Technical analysis tools will work for you only if you have the discipline to wait for patterns to emerge. Professionals trade only when markets offer them special advantages.
According to chaos theory, many processes—the flow of water in a river, the movement of clouds in the sky, the changes of prices in the cotton markets—are chaotic, with transient islands of order, called fractals. Those fractals look similar from any distance, whether through a telescope or a microscope. The coast of Maine looks just as jagged from a space shuttle as it does when you drop down on your hands and knees and look at it through a magnifying glass. In most financial markets, the long-term weekly charts and the short-term 5-minute charts look so similar, you cannot tell them apart without markings.
Engineers have realized that they can achieve better control over many processes if they accept them as chaotic and try to capitalize on temporary fractals, the islands of order. That’s exactly what a good trader does. He recognizes the market as chaotic and unpredictable much of the time, but expects to find islands of order. He trains himself to buy and sell without quibbling when he finds those patterns. Successful trading depends on the 3 M’s—Mind, Method, and Money. Beginners focus on analysis, but professionals operate in a threedimensional space. They are aware of trading psychology—their own feelings and the mass psychology of the markets. Each trader needs to have a method for choosing specific stocks, options, or futures as well as firm rules for pulling the trigger—deciding when to buy and sell. Money refers to how you manage your trading capital.
Mind, Method, Money—trading psychology, trading method, and money management—people sometimes ask me which of the three is more important. It is like asking which leg of a three-legged stool is the most important. Take them away one at a time and then try to sit down. In Part 2 we focus on those three foundations of market success.
Subscribe to:
Posts (Atom)
Popular Posts
-
 LEARNING TO LOVE TO TAKE A LOSS I realized early on in my trading career that one of the most common characteristics in almost all su...
 -
 Will this stock rise or fall? Should you go long or short? Traders reachfor a multitude of tools to find answers to these questions. Many t...
 -
Bad Luck People who like to complain about their bad luck are often experts in looking for trouble and snatching defeat from the jaws ...
-
Many people give little thought to life’s important decisions. They stumble into them by accidents of geography, time, or chance. Where to ...
-
Are traders born or made? There is no simple answer. Both aptitude and learning are important, but in different proportions for different p...
-
 A successful trader is like a fish swimming upstream, against the current. Commissions, slippage, and expenses keep pushing you back. You m...


